As Bill McKibben notes, something seems amiss with this chart.
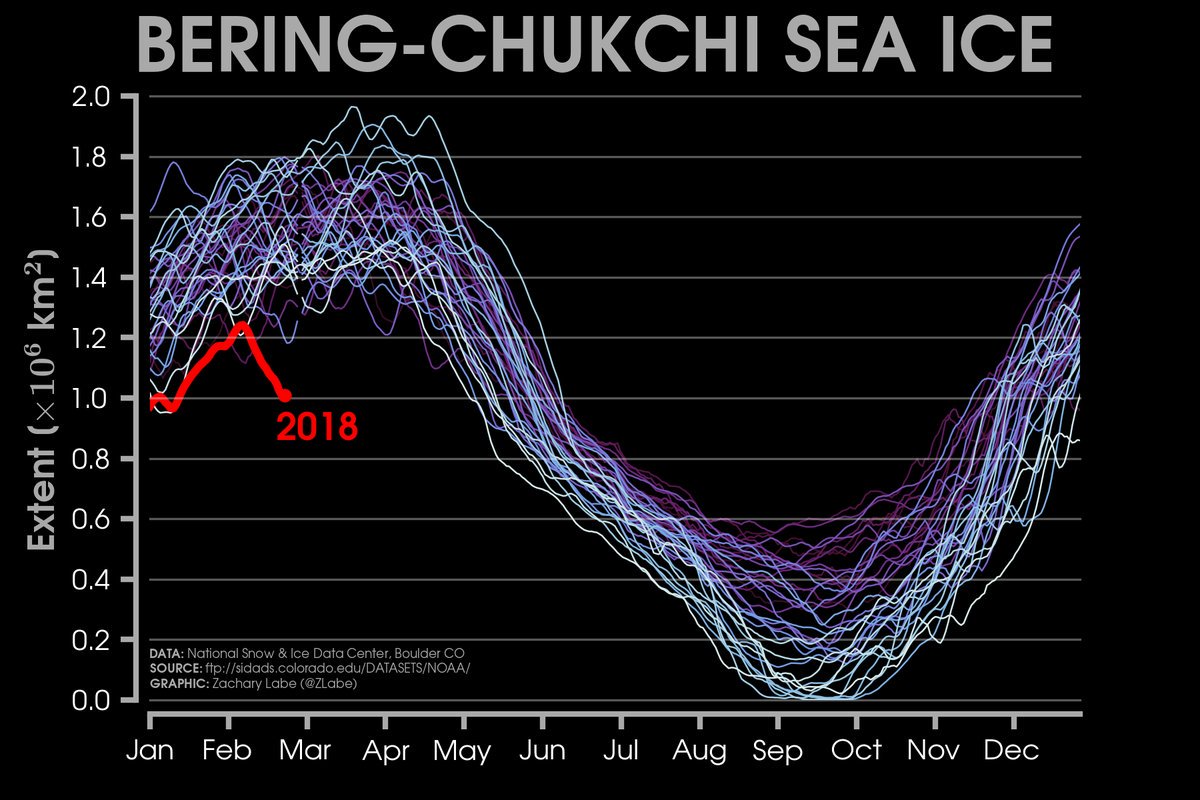
Chart from data from the National Snow and Ice Data Center (NSIDC) showing sea ice in the Bering-Chukchi Sea; 2018’s ice decline in red. Graphic by Zachary Labe.
The U.S. National Snow and Ice Data Center in Boulder, Colorado, track ice in the Arctic. The chart shows extent of sea ice in square kilometers, with a comparison of about the past 20 years.
In red, you see what is happening to the ice in 2018 — a dramatic melt, a dramatic plunge in the amount of sea ice.
Arctic Circle area temperatures rose dramatically above normal temperatures for winter in the past few weeks, by 25 to 40 degrees Fahrenheit (see report in the Sydney Morning Herald). Such dramatic increases frequently result when a weakened jet stream fails to keep cold Arctic air in the Arctic — and the polar vortex slips to give some temperate latitude land incredible freezes. The colds that get reported on the news and touted by science dissenters as evidence Global Warming does not occur, are the result of those heat blobs in the Arctic.
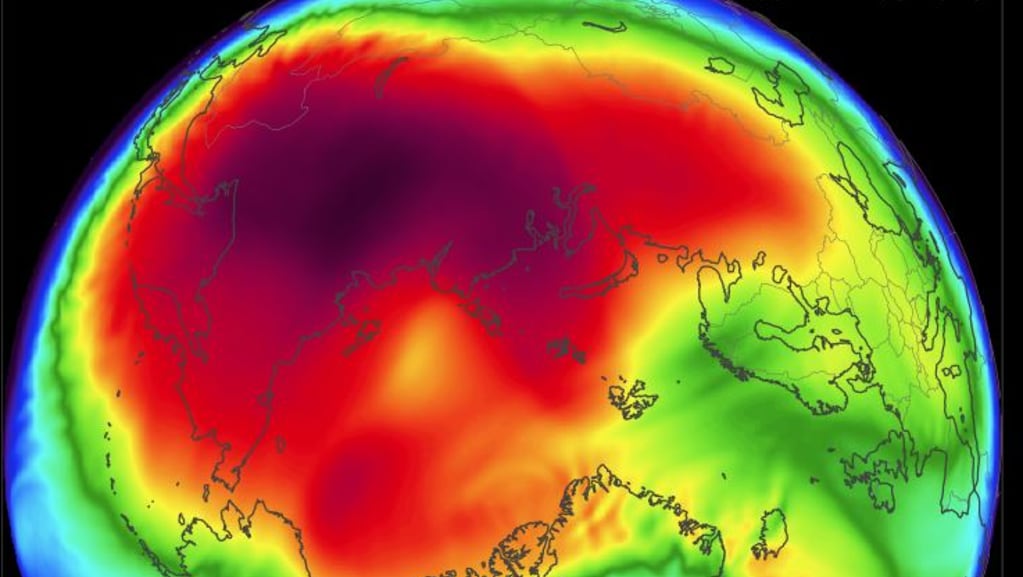
Sydney (Australia) Morning Herald reports: Arctic temperatures in February 2018 are averaging well above normal, and peaking up to 25 degrees higher than normal. Photo: globalweatherlogistics.com
Tipping points are not always discernable in real time. This may be an exception.
Time to act, people!
Tip of the old scrub brush to Bill McKibben, of course.


