— Chip Giller Founder of Grist.org, where
environmentally-minded people
gather online.
Look! Someone found the same cup I found!
I miss those old Starbucks cups — but then, they killed the Starbucks in our town. I don’t buy the 100 cups of Starbucks coffee I used to get in a year.
This is mostly a reprise of a post from October, in which we noted that climate scientist James Hansen‘s off-handed prediction of what might be warming damage to New York had come true. Not that Hansen wanted it to ever occur, but Hansen’s conjecture had been the subject of great ridicule attempts in the warming [choose one: denialists’, critics’, apologists’s] Gish Gallop rebuttal attempts.
As it is again. This time, a discussant pointed the Anthony Watts’s Carnival of Misbelief as the source of a claim which, the discussant said, proved liberals don’t like facts.
Watts made the same error Steve Goddard made, of course. Watts corrected one erroneous detail — the time in which Hansen said it might occur — but tried to make the ridicule stick:
As of this update in March 2011, we’re 23 years into his prediction of the West Side Highway being underwater. From what I can measure in Google Earth, Dr. Hansen would need at least a ten foot rise in forty years to make his prediction work. See this image below from Google Earth where I placed the pointe over the West Side Highway, near the famous landmark and museum, the USS Intrepid:
According to Google Earth, the West Side Highway is 10 feet above sea level here – click to enlarge
The lat/lon should you wish to check yourself is: 40.764572° -73.998498°
We turn to the events of last October, and the storm that was Hurricane Sandy, which slammed into New Jersey and New York, and that same West Side Highway.
Could someone go over to Goddard’s blog for me ( I have been banned three times most recently for having the gall to suggest he was wrong in ridiculing the possibility of a new record minimum SIE this year. ) and ask for his apology to Hansen for ridiculing the possibility of the West Side Highway being underwater. I just saw a video showing the West Side Highway underwater.
According to NASA’s top scientist, Manhattan has been underwater for the past four years, and is experiencing a horrific drought.
While doing research 12 or 13 years ago, I met Jim Hansen, the scientist who in 1988 predicted the greenhouse effect before Congress. I went over to the window with him and looked out on Broadway in New York City and said, “If what you’re saying about the greenhouse effect is true, is anything going to look different down there in 20 years?” He looked for a while and was quiet and didn’t say anything for a couple seconds. Then he said, “Well, there will be more traffic.” I, of course, didn’t think he heard the question right. Then he explained, “The West Side Highway [which runs along the Hudson River] will be under water. And there will be tape across the windows across the street because of high winds. And the same birds won’t be there. The trees in the median strip will change.” Then he said, “There will be more police cars.” Why? “Well, you know what happens to crime when the heat goes up.”
Goddard’s blog has used Hansen’s quote as a regular punchline, not noticing that Hansen said “in 20 to 30 years,” and assuming he was just awfully, comically wrong. 30 years from 1988 will be 2018. This year is 2012, six years to go. Goddard tried to ridicule Hansen a few times over the past couple of years, for example:
AP may complain about this use, but this is an academic, learning exercise:
Caption from Yahoo! News: This photo provided by Dylan Patrick shows flooding along the Westside Highway near the USS Intrepid as Sandy moves through the area Monday, Oct. 29, 2012 in New York. Much of New York was plunged into darkness Monday by a superstorm that overflowed the city’s historic waterfront, flooded the financial district and subway tunnels and cut power to nearly a million people. (AP Photo/Dylan Patrick) MANDATORY CREDIT: DYLAN PATRICK
Dylan Patrick got the photographic evidence that shows, once again, warming denialists really are a classless, fact-lacking bunch. CNN has photos from Dylanphoto1 (the same guy, almost certainly), in a slide show, noting, “Most of the Westside Highway south of 49th street is flooded all the way down, and in front of the USS Intrepid.” Across from Pier 88 and the USS Intrepid, the street is indeed underwater.
So we learn that, as a comedian, Steve Goddard has an extremely limited range and depends on a sympathetic room to get laughs; and as a climate scientist, he is even more limited, and wrong, with 6 years to go in the 20 to 30 year range James Hansen offered. And we learn once again, sadly, that James Hansen was right back in 1988 when he hit the claxons to warn us of global warming.
23 times Goddard repeated the charge? Do you get the idea that “climate skeptics” ran out of material years ago, and have been dancing a cover-up for a very, very long time? Hurricane Sandy blew and floated his claim away.
In this reprise post, I add three photos to make it even more clear what happened:
From CNN: By dylanphoto1 | Posted October 29, 2012 | NYC, NY, New York — CNN PRODUCER NOTE dylanphoto1 told me, ‘It was fairly quiet with large gusts of wind and some rain. There were other people out and about taking photos and commenting on how crazy it is to see the water covering the highway. Cops were out chasing people off the highway.’
Yes, Dear Reader, that is indeed Pier 88. New Yorkers probably recognize it as the berthing place of the U.S.S. Intrepid, the same ship Watts shows in his photo, while laughingly promising that the West Side Highway would never be flooded by the ocean at that spot. Never?
CNN image, photo by dylanphoto1; in this view, Pier 88’s denizen, the U.S.S. Intrepid, can clearly be seen by the name on the stern of the ship.
One more photo from dylanphoto1:
At New York City’s Pier 88, the U.S.S. Intrepid, with the West Side Highway in the foreground, covered by surging and rising ocean waters.
So there you have it. Some conservatives will deny the science they claim to cling to, blaming liberals or James Hansen for being right all along.
See this United Nations Development Program ten-minute video that, to the wise and concerned, lays out the stakes of delaying action against human-caused climate change.
Without enough funding, NGOs work to help farmers getting hammered in the Southern Philippines, and other places.
In the Southern Philippines, farmers’ lives and the weather are intimately interwoven, but something is changing, now that the rains in Agusan del Norte are too heavy, the sun shines too fiercely. Now there’s hope for poor farmers with the community-based approach monitoring and Weather Index-Based Insurance packages, to warn people when heavy weather is on the way.
Though, I do weary of the astonishing abuse of acronyms in this work-of-the-angels. “WIBI?”
Incidentally, though the phrase doesn’t appear anywhere in this material, this is exactly the sort of work carried on by the UN’s Agenda 21 project. Doesn’t look subversive to me.
Tip of the old scrub brush to the UNDP and ILO Tweet:
One of the most southerly populations of polar bears in the world – and the best studied – is struggling to cope with climate-induced changes to sea ice, new research reveals. Based on over 10 years’ data the study, published in the British Ecological Society‘s Journal of Animal Ecology, sheds new light on how sea ice conditions drive polar bears’ annual migration on and off the ice.
Led by Dr. Seth Cherry of the University of Alberta, the team studied polar bears in western Hudson Bay, where sea ice melts completely each summer and typically re-freezes from late November to early December. “This poses an interesting challenge for a species that has evolved as a highly efficient predator of ice-associated seals,” he explains. “Because although polar bears are excellent swimmers compared with other bear species, they use the sea ice to travel, hunt, mate and rest.”
Caption from EurekAlert: An adult female polar bear wearing a GPS-satellite linked collar with her two 10-month-old cubs waits for the sea ice to re-form onshore in western Hudson Bay, Manitoba, Canada. Photo Copyright Andrew Derocher, Univeristy of Alberta.
Polar bears have adapted to the annual loss of sea ice by migrating onto land each summer. While there, they cannot hunt seals and must rely on fat reserves to see them through until the ice returns.
Dr. Cherry and colleagues wanted to discover how earlier thawing and later freezing of sea ice affects the bears’ migration. “At first glance, sea ice may look like a barren, uniform environment, but in reality, it’s remarkably complex and polar bears manage to cope, and even thrive, in a habitat that moves beneath their feet and even disappears for part of the year. This is an extraordinary biological feat and biologist still don’t fully understand it,” he says.
From 1991-97 and 2004-09, they monitored movements of 109 female polar bears fitted with satellite tracking collars. They tagged only females because males’ necks are wider than their heads, so they cannot wear a collar. During the same period, the team also monitored the position and concentration of sea ice using satellite images.
“Defining precisely what aspects of sea ice break-up and freeze-up affect polar bear migration, and when these conditions occur, is a vital part of monitoring how potential climate-induced changes to sea ice freeze-thaw cycles may affect the bears,” he says.
The results reveal the timing of polar bears’ migration can be predicted by how fast the sea ice melts and freezes, and by when specific sea ice concentrations occur within a given area of Hudson Bay.
According to Dr. Cherry: “The data suggest that in recent years, polar bears are arriving on shore earlier in the summer and leaving later in the autumn. These are precisely the kind of changes one would expect to see as a result of a warming climate and may help explain some other studies that are showing declines in body condition and cub production.”
Recent estimates put the western Hudson Bay polar bear population at around 900 individuals. The population has declined since the 1990s, as has the bears’ body condition and the number of cubs surviving to adulthood.
Caption from EurekAlert: This is a subadult polar bear on a lake on the shores of Hudson Bay in Manitoba, Canada in November waiting for the sea ice to re-form. Copyright Andrew Derocher, Univeristy of Alberta.
Because polar bears’ main food source is seals, and these are hunted almost exclusively on sea ice, the longer bears spend on land, the longer they must go without energy-rich seals. “Climate-induced changes that cause sea ice to melt earlier, form later, or both, likely affect the overall health of polar bears in the area. Ultimately, for polar bears, it’s survival of the fattest,” says Dr. Cherry.
He hopes the results will enable other scientists and wildlife managers to predict how potential climate-induced changes to sea ice freeze-thaw cycles will affect the ecology, particularly the migration patterns, of this iconic species.
###
Seth Cherry et al (2013). ‘Migration phenology and seasonal fidelity of an Arctic marine predator in relation to sea ice dynamics’, doi: 10.1111/1365-2656.12050, is published in the Journal of Animal Ecology on Wednesday 20 March 2013.
Starving polar bears. (loe.org) (This site has a good, but very sad, interview with Dr. Derocher; it also links to an audio of the Living On Earth radio program from which the interview is excerpted.)
From NASA: Of the 10 million square miles (26 million square kilometers) of northern vegetated lands, 34 to 41 percent showed increases in plant growth (green and blue), 3 to 5 percent showed decreases in plant growth (orange and red), and 51 to 62 percent showed no changes (yellow) over the past 30 years. Satellite data in this visualization are from the AVHRR and MODIS instruments, which contribute to a vegetation index that allows researchers to track changes in plant growth over large areas. Credit: NASA’s Goddard Space Flight Center Scientific Visualization Studio; click image for original view; click here for greater detail
Press release from NASA, March 10, 2013 (links in text added here):
WASHINGTON — Vegetation growth at Earth’s northern latitudes increasingly resembles lusher latitudes to the south, according to a NASA-funded study based on a 30-year record of land surface and newly improved satellite data sets.
An international team of university and NASA scientists examined the relationship between changes in surface temperature and vegetation growth from 45 degrees north latitude to the Arctic Ocean. Results show temperature and vegetation growth at northern latitudes now resemble those found 4 degrees to 6 degrees of latitude farther south as recently as 1982.
“Higher northern latitudes are getting warmer, Arctic sea ice and the duration of snow cover are diminishing, the growing season is getting longer and plants are growing more,” said Ranga Myneni of Boston University’s Department of Earth and Environment. “In the north’s Arctic and boreal areas, the characteristics of the seasons are changing, leading to great disruptions for plants and related ecosystems.”
The study was published Sunday in the journal Nature Climate Change.
Myneni and colleagues used satellite data to quantify vegetation changes at different latitudes from 1982 to 2011. Data used in this study came from NOAA’s Advanced Very High Resolution Radiometers (AVHRR) onboard a series of polar-orbiting satellites and NASA’s Moderate Resolution Imaging Spectroradiometer (MODIS) instruments on the Terra and Aqua satellites.
As a result of enhanced warming and a longer growing season, large patches of vigorously productive vegetation now span a third of the northern landscape, or more than 3.5 million square miles (9 million square kilometers). That is an area about equal to the contiguous United States. This landscape resembles what was found 250 to 430 miles (400 to 700 kilometers) to the south in 1982.
“It’s like Winnipeg, Manitoba, moving to Minneapolis-Saint Paul in only 30 years,” said co-author Compton Tucker of NASA’s Goddard Space Flight Center in Greenbelt, Md.
The Arctic’s greenness is visible on the ground as an increasing abundance of tall shrubs and trees in locations all over the circumpolar Arctic. Greening in the adjacent boreal areas is more pronounced in Eurasia than in North America.
An amplified greenhouse effect is driving the changes, according to Myneni. Increased concentrations of heat-trapping gasses, such as water vapor, carbon dioxide and methane, cause Earth’s surface, ocean and lower atmosphere to warm. Warming reduces the extent of polar sea ice and snow cover, and, in turn, the darker ocean and land surfaces absorb more solar energy, thus further heating the air above them.
“This sets in motion a cycle of positive reinforcement between warming and loss of sea ice and snow cover, which we call the amplified greenhouse effect,” Myneni said. “The greenhouse effect could be further amplified in the future as soils in the north thaw, releasing potentially significant amounts of carbon dioxide and methane.”
To find out what is in store for future decades, the team analyzed 17 climate models. These models show that increased temperatures in Arctic and boreal regions would be the equivalent of a 20-degree latitude shift by the end of this century relative to a period of comparison from 1951-1980.
However, researchers say plant growth in the north may not continue on its current trajectory. The ramifications of an amplified greenhouse effect, such as frequent forest fires, outbreak of pest infestations and summertime droughts, may slow plant growth.
Also, warmer temperatures alone in the boreal zone do not guarantee more plant growth, which also depends on the availability of water and sunlight.
“Satellite data identify areas in the boreal zone that are warmer and dryer and ¬¬other areas that are warmer and wetter,” said co-author Ramakrishna Nemani of NASA’s Ames Research Center in Moffett Field, Calif. “Only the warmer and wetter areas support more growth.”
Researchers did find found more plant growth in the boreal zone from 1982 to 1992 than from 1992 to 2011, because water limitations were encountered in the latter two decades.
Data, results and computer codes from this study will be made available on NASA Earth Exchange (NEX), a collaborative supercomputing facility at Ames. NEX is designed to bring scientists together with data, models and computing resources to accelerate research and innovation and provide transparency.
For more information and images associated with this release, visit:
I wish it weren’t true. I wish people didn’t appear to be getting stupider, less scientifically literate, and less knowledgeable of history (see Santayana‘s thoughts in the upper right-hand corner of the blog . . .). My e-mail box is filling today with notes from people claiming environmentalists want to rid the Earth of humans, urging that we should oppose them and let poisoning of our air and water continue . . . oblivious to the irony of the claim coupled with their supposed opposition to the idea. Here’s the truth, in large part, an encore post from several months ago (I apologize in advance for the necessary profanity):
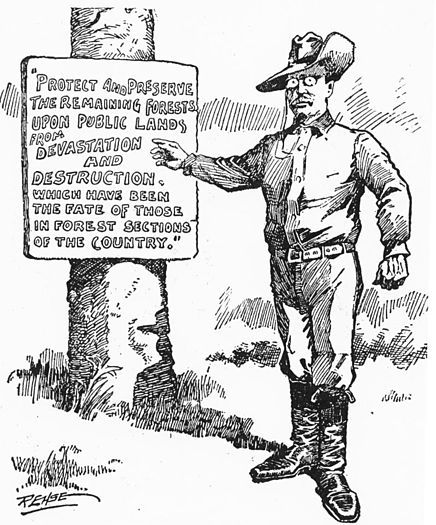
The fictional but very popular memes that environmentalists hate humans, humanity and capitalism wouldn’t bother me so much if they didn’t blind their believers to larger truths and sensible policies on environmental protection.
1908 Rense editorial cartoon of President Theodore Roosevelt as “A Practical Forester.” Source: St. Paul Minnesota “Pioneer Press”. Via GPO’s Government Book Talk blog.
Spread the word; friends don't allow friends to repeat history.
Al Gore and Barack Obama don’t appear to be on the opposite side of most issues, especially not climate change. Here they appear together in Detroit, circa June 11, 2012 – Rebecca Cook photo for Reuters, via NBC News photo
Anthony Watts strays farther and further from science with every passing day, and most of his new posts.
At the moment he’s got a doozy of a post, citing a bovine excrement question on a CFACT billboard, and offering a push-poll with three choices designed to push Watts’s preferred political answer, that ‘Obama and Gore go in different directions on global warming and climate change, and maybe they are both wrong.’ The end message Watts pushes is wrong, as you can see in the full texts below.(Morgan, here’s the link so you don’t have to flounder around with Google.)
It’s based on these two quote mine products from the CFACT billboard:
WHAT DO YOU BELIEVE?
“Hurricane Sandy is a disturbing sign of things to come.” — Al Gore, 10/30/2012
“We can’t attribute any particular weather event to global warming.” — Barack Obama, 11/14/2012
Propaganda group CFACT’s quote mining billboard, on which Anthony Watts’s push-poll is based.
Watts doesn’t offer a “both correct” choice. That would be the accurate answer.
Gore’s comment at his blog on October 30, 2012, noted that while we can’t attribute the formation of Sandy to climate change, the effects of the storm were magnified by climate change. Gore called that “disturbing.”
Obama, noting that while we can’t say for certain that any particular storm is caused entirely from human-created global warming, the long-term effects clearly have human causation and we need to act to stop it.
In short, Gore and Obama take the same side on this issue, the side of science and making sound public policy. Watts works the old tobacco company strategy, suggesting that wherever studies showing health harms from tobacco differ from each other in the slightest jot or tittle, that means scientists can’t decide whether tobacco is harmful — substitute “human-caused climate change” for tobacco in that argument, and you see what Watts is trying to do.
Statement on Hurricane Sandy October 30, 2012 : 1:21 PM
This week, our nation has anxiously watched as Hurricane Sandy lashed the East Coast and caused widespread damage–affecting millions. Now more than ever, our neighbors need our help. Please consider donating or volunteering for your local aid organizations.
The images of Sandy’s flooding brought back memories of a similar–albeit smaller scale– event in Nashville just two years ago. There, unprecedented rainfall caused widespread flooding, wreaking havoc and submerging sections of my hometown. For me, the Nashville flood was a milestone. For many, Hurricane Sandy may prove to be a similar event: a time when the climate crisis—which is often sequestered to the far reaches of our everyday awareness became a reality.
While the storm that drenched Nashville was not a tropical cyclone like Hurricane Sandy, both storms were strengthened by the climate crisis. Scientists tell us that by continually dumping 90 million tons of global warming pollution into the atmosphere every single day, we are altering the environment in which all storms develop. As the oceans and atmosphere continue to warm, storms are becoming more energetic and powerful. Hurricane Sandy, and the Nashville flood, were reminders of just that. Other climate-related catastrophes around the world have carried the same message to hundreds of millions.
Sandy was also affected by other symptoms of the climate crisis. As the hurricane approached the East Coast, it gathered strength from abnormally warm coastal waters. At the same time, Sandy’s storm surge was worsened by a century of sea level rise. Scientists tell us that if we do not reduce our emissions, these problems will only grow worse.
Hurricane Sandy is a disturbing sign of things to come. We must heed this warning and act quickly to solve the climate crisis. Dirty energy makes dirty weather.
President Obama’s statement, excerpted from his November 14, 2012, press conference:
THE PRESIDENT: Mark Landler. Where’s Mark? There he is right in front of me.
Q Thank you, Mr. President. In his endorsement of you a few weeks ago, Mayor Bloomberg said he was motivated by the belief that you would do more to confront the threat of climate change than your opponent. Tomorrow you’re going up to New York City where you’re going to, I assume, see people who are still suffering the effects of Hurricane Sandy, which many people say is further evidence of how a warming globe is changing our weather. What specifically do you plan to do in a second term to tackle the issue of climate change? And do you think the political will exists in Washington to pass legislation that could include some kind of a tax on carbon?
THE PRESIDENT: As you know, Mark, we can’t attribute any particular weather event to climate change. What we do know is the temperature around the globe is increasing faster than was predicted even 10 years ago. We do know that the Arctic ice cap is melting faster than was predicted even five years ago. We do know that there have been extraordinarily — there have been an extraordinarily large number of severe weather events here in North America, but also around the globe.
And I am a firm believer that climate change is real, that it is impacted by human behavior and carbon emissions. And as a consequence, I think we’ve got an obligation to future generations to do something about it.
Now, in my first term, we doubled fuel efficiency standards on cars and trucks. That will have an impact. That will take a lot of carbon out of the atmosphere. We doubled the production of clean energy, which promises to reduce the utilization of fossil fuels for power generation. And we continue to invest in potential breakthrough technologies that could further remove carbon from our atmosphere. But we haven’t done as much as we need to.
So what I’m going to be doing over the next several weeks, next several months, is having a conversation, a wide-ranging conversation with scientists, engineers, and elected officials to find out what can — what more can we do to make a short-term progress in reducing carbons, and then working through an education process that I think is necessary — a discussion, a conversation across the country about what realistically can we do long term to make sure that this is not something we’re passing on to future generations that’s going to be very expensive and very painful to deal with.
I don’t know what either Democrats or Republicans are prepared to do at this point, because this is one of those issues that’s not just a partisan issue; I also think there are regional differences. There’s no doubt that for us to take on climate change in a serious way would involve making some tough political choices. And understandably, I think the American people right now have been so focused, and will continue to be focused on our economy and jobs and growth, that if the message is somehow we’re going to ignore jobs and growth simply to address climate change, I don’t think anybody is going to go for that. I won’t go for that.
If, on the other hand, we can shape an agenda that says we can create jobs, advance growth, and make a serious dent in climate change and be an international leader, I think that’s something that the American people would support.
So you can expect that you’ll hear more from me in the coming months and years about how we can shape an agenda that garners bipartisan support and helps move this agenda forward.
Q Sounds like you’re saying, though, in the current environment, we’re probably still short of a consensus on some kind of attack.
THE PRESIDENT: That I’m pretty certain of. And, look, we’re still trying to debate whether we can just make sure that middle-class families don’t get a tax hike. Let’s see if we can resolve that. That should be easy. This one is hard — but it’s important because one of the things that we don’t always factor in are the costs involved in these natural disasters; we just put them off as something that’s unconnected to our behavior right now. And I think what — based on the evidence we’re seeing, is that what we do now is going to have an impact and a cost down the road if we don’t do something about it.
In context, can you point to any points of conflict between what Al Gore said in October, and what President Obama said a couple of weeks later? To me it looks as if they’re singing very much from the the same hymnal or songbook, and they’re in harmony, if not unison, especially in what I’ve turned into red-letter text.
Here’s the video of the entire Obama press conference (climate question comes at 42:19 in the video transcript):
This is a press release from NASA, presented here for the record, text unedited except for formatting where necessary, and the deletion of the press office phone numbers (I hope that’s not necessary, but earnest information seekers have links to get the information they seek). Images are inserted from other, related NASA sites.
NASA Finds 2012 Sustained Long-Term Climate Warming Trend
WASHINGTON — NASA scientists say 2012 was the ninth warmest of any year since 1880, continuing a long-term trend of rising global temperatures. With the exception of 1998, the nine warmest years in the 132-year record all have occurred since 2000, with 2010 and 2005 ranking as the hottest years on record.
NASA’s Goddard Institute for Space Studies (GISS) in New York, which monitors global surface temperatures on an ongoing basis, released an updated analysis Tuesday that compares temperatures around the globe in 2012 to the average global temperature from the mid-20th century. The comparison shows how Earth continues to experience warmer temperatures than several decades ago.
[Caption to video] NASA’s analysis of Earth’s surface temperature found that 2012 ranked as the ninth-warmest year since 1880. NASA scientists at the Goddard Institute for Space Studies (GISS) compare the average global temperature each year to the average from 1951 to 1980. This 30-year period provides a baseline from which to measure the warming Earth has experienced due to increasing atmospheric levels of heat-trapping greenhouse gases. While 2012 was the ninth-warmest year on record, all 10 of the warmest years in the GISS analysis have occurred since 1998, continuing a trend of temperatures well above the mid-20th century average. The record dates back to 1880 because that is when there were enough meteorological stations around the world to provide global temperature data. Data source: NASA Goddard Institute for Space Studies Visualization credit: NASA Goddard’s Scientific Visualization Studio
The average temperature in 2012 was about 58.3 degrees Fahrenheit (14.6 Celsius), which is 1.0 F (0.6 C) warmer than the mid-20th century baseline. The average global temperature has risen about 1.4 degrees F (0.8 C) since 1880, according to the new analysis.
Scientists emphasize that weather patterns always will cause fluctuations in average temperature from year to year, but the continued increase in greenhouse gas levels in Earth’s atmosphere assures a long-term rise in global temperatures. Each successive year will not necessarily be warmer than the year before, but on the current course of greenhouse gas increases, scientists expect each successive decade to be warmer than the previous decade.
“One more year of numbers isn’t in itself significant,” GISS climatologist Gavin Schmidt said. “What matters is this decade is warmer than the last decade, and that decade was warmer than the decade before. The planet is warming. The reason it’s warming is because we are pumping increasing amounts of carbon dioxide into the atmosphere.”
Carbon dioxide is a greenhouse gas that traps heat and largely controls Earth’s climate. It occurs naturally and also is emitted by the burning of fossil fuels for energy. Driven by increasing man-made emissions, the level of carbon dioxide in Earth’s atmosphere has been rising consistently for decades.
The carbon dioxide level in the atmosphere was about 285 parts per million in 1880, the first year in the GISS temperature record. By 1960, the atmospheric carbon dioxide concentration, measured at NOAA’s Mauna Loa Observatory, was about 315 parts per million. Today, that measurement exceeds 390 parts per million.
This map represents global temperature anomalies averaged from 2008 through 2012. Data source: NASA Goddard Institute for Space Studies Visualization credit: NASA Goddard’s Scientific Visualization Studio
While the globe experienced relatively warm temperatures in 2012, the continental U.S. endured its warmest year on record by far, according to NOAA, the official keeper of U.S. weather records.
“The U.S. temperatures in the summer of 2012 are an example of a new trend of outlying seasonal extremes that are warmer than the hottest seasonal temperatures of the mid-20th century,” GISS director James E. Hansen said. “The climate dice are now loaded. Some seasons still will be cooler than the long-term average, but the perceptive person should notice that the frequency of unusually warm extremes is increasing. It is the extremes that have the most impact on people and other life on the planet.”
The temperature analysis produced at GISS is compiled from weather data from more than 1,000 meteorological stations around the world, satellite observations of sea-surface temperature, and Antarctic research station measurements. A publicly available computer program is used to calculate the difference between surface temperature in a given month and the average temperature for the same place during 1951 to 1980. This three-decade period functions as a baseline for the analysis. The last year that experienced cooler temperatures than the 1951 to 1980 average was 1976.
The GISS temperature record is one of several global temperature analyses, along with those produced by the Met Office Hadley Centre in the United Kingdom and the National Oceanic and Atmospheric Administration’s National Climatic Data Center in Asheville, N.C. These three primary records use slightly different methods, but overall, their trends show close agreement.
It’s taken too long, but the reports on climate change, required by a 1990 law, flow down the government report-to-the-public pipeline once again. Mother Jones reports six chief points in the draft document, for which comments are invited before a final document will be issued:
Climate change is definitely caused by human activities. Always nice to hear government officials acknowledge this essential fact. And the report concedes that our only hope of curbing warming is to kick our addiction to greenhouse-gas spewing fossil fuels.
Extreme weather is increasing, and that’s our fault, too. In particular, searing temperatures, heavy rain, and prolonged drought.
Weather isn’t the only threat we have to worry about. The list sounds like the side-effect warnings at the end of a prescription drug commercial: decreased air quality, insect-borne diseases, and “threats to mental health” are all on the docket for the coming decades.
Our infrastructure is getting hammered, and we’re not spending enough to save it. Floods are destroying farmland; extreme heat is damaging roads, rail lines, and airports; and military installations are at risk.
Food and water security will be up in the air. Especially in water-scarce regions like the Southwest, decreasing snowpack and shrinking groundwater supplies will spark competition for water between “agricultural, municipal, and environmental” uses. At the same time, heavy floods could put water quality at risk with sediment and chemical contaminates. And by mid-century, efforts to artificially protect agriculture (like expanded irrigation) could be over-ridden by temperature and precipitation extremes.
Climate change is hitting plants and animals just as hard as us. Beaches, forests, wetlands, and other ecosystems could shrink or disappear, especially a problem when they play a role in mitigating the impact from extreme weather. And warming, acidifying seas could slam sea life.
The document is available to read online; public comments are invited, but must come in a specific form to be analyzed (the authors expect a lot of comments, and a lot of detailed comments). Here’s the transmission document from the agency (a few links added here):
Federal Advisory Committee Draft Climate Assessment Report Released for Public Review
A 60-person Federal Advisory Committee (The “National Climate Assessment and Development Advisory Committee” or NCADAC) has overseen the development of this draft climate report.
The NCADAC, whose members are available here (and in the report), was established under the Department of Commerce in December 2010 and is supported through the National Oceanic and Atmospheric Administration (NOAA). It is a federal advisory committee established as per the Federal Advisory Committee Act of 1972. The Committee serves to oversee the activities of the National Climate Assessment. Its members are diverse in background, expertise, geography and sector of employment. A formal record of the committee can be found at the NOAA NCADAC website.
The NCADAC has engaged more than 240 authors in the creation of the report. The authors are acknowledged at the beginning of the chapters they co-authored.
Following extensive review by the National Academies of Sciences and by the public, this report will be revised by the NCADAC and, after additional review, will then be submitted to the Federal Government for consideration in the Third National Climate Assessment (NCA) Report. For more information on the NCA process and background, previous assessments and other NCA information, please explore the NCA web-pages. The NCA is being conducted under the auspices of the Global Change Research Act of 1990 and is being organized and administered by the Global Change Research Program.
To simply access and read the draft report, please download the chapters below. However, if you would like to submit comments on the report as part of the public process, you will need to enter the “review and comment system” and register with your name and e-mail address and agree to the terms. All comments must be submitted through the review and comment system.
Contents of the report, chapter by chapter, for your download:
Download Chapters of the NCADAC Draft Climate Assessment Report!
Download the Full Report (warning, 147Mb. Very large file)Between chapters, there are some page numbers that are not used. This is intentional and does not reflect missing pages.or download each chapter separately:
Between January 14th and April 12th only: Please go to the Review and Comment System to provide comments on the draft.
You must register and accept the terms in the Review and Comment System in order to review this document. Comments will only be accepted through this system.
NOTE: You will not be allowed to create an account in the system prior to 9am ET January 14th, 2013, and the comment period ends at 5pm ET on April 12th, 2013
If 2012 was, indeed, the year excrement got real in climate change, perhaps 2013 can be the year we start to do something about it.
333 months of worldwide temperature averages above the 20th century average — a kid younger than 27.5 years has never lived through a single month cooler than the 20th century average for that month. We’re well into the second generation of people who know nothing but global warming.
A reasonable and smart person might note that one does not need to be a student of advanced statistics to spot a trend here.
The combined average temperature over global land and ocean surfaces for November was the fifth highest on record for November, at 56.41°F (13.67°C) or 1.21°F (0.67°C) above the 20th century average. The margin of error associated with this temperature is ±0.13°F (0.07°C).
November marked the 36th consecutive November and 333rd consecutive month with a global temperature above the 20th century average. The last below-average temperature November was November 1976 and the last below-average temperature month was February 1985.
The global land temperature was the sixth warmest November on record, at 2.03°F (1.13°C) above the 20th century average. The margin of error is ±0.20°F (0.11°C).
Just a look at the extremes in November should be alarming, especially if you live in the USA.
Selected Significant Climate Anomalies and Events, November 2012; click for larger, more-easily-viewed image
More evidence that Michael Mann‘s “hockey stick” graph is vindicated; more evidence that we should not regard James Hansen as we did Cassandra, but should instead heed his warnings.
Myths and Facts about Global Warming (wattsupwiththat.com) (The climate change denialist voice, here in usual form demonstrating how use of red herrings, bait-and-switch, and outright fabrication can make someone appear knowledgeable about a topic, and accurate in foolish criticism.)
Global warming deniers often claim that bias prevents them from publishing in peer-reviewed journals. But 24 articles in 18 different journals, collectively making several different arguments against global warming, expose that claim as false. Articles rejecting global warming can be published, but those that have been have earned little support or notice, even from other deniers.
A few deniers have become well known from newspaper interviews, Congressional hearings, conferences of climate change critics, books, lectures, websites and the like. Their names are conspicuously rare among the authors of the rejecting articles. Like those authors, the prominent deniers must have no evidence that falsifies global warming.
Anyone can repeat this search and post their findings. Another reviewer would likely have slightly different standards than mine and get a different number of rejecting articles. But no one will be able to reach a different conclusion, for only one conclusion is possible: Within science, global warming denial has virtually no influence. Its influence is instead on a misguided media, politicians all-too-willing to deny science for their own gain, and a gullible public.
Scientists do not disagree about human-caused global warming. It is the ruling paradigm of climate science, in the same way that plate tectonics is the ruling paradigm of geology. We know that continents move. We know that the earth is warming and that human emissions of greenhouse gases are the primary cause. These are known facts about which virtually all publishing scientists agree.
Global Warming To Cause A New Ice Age (stevengoddard.wordpress.com) (This is a mostly parody site; satires are poorly labeled, however, as are solid reports.)
Photo of water in 86th Street Station in Brooklyn, NY, after Sandy – photo found at Naked Capitalism. Denialists could note that subway crime was significantly reduced at the time of this photo.
It’s a classic example of how rabid advocacy for a disproven position can predict that the rabid advocate will not change her/his mind, at least publicly.
Symphony of Science: Highest and best use of Autotune — does putting stuff to music make for better editing? (Great question in the 100th anniversary year of Woody Guthrie‘s birth, yes?)
Al Gore as the climate change denialists fear him most, approachable, concise, powerful images, and in tune:
The report concludes that “governments and businesses can no longer assume that a two-degree warming world is the default scenario”, and urges greater planning to cope with the disruptive effects that more unpredictable and extreme weather will have on supply chains, long-term assets, and infrastructure, particularly in coastal or low-lying regions.
Meanwhile, businesses in carbon-intensive sectors must also anticipate “invasive regulation” and the possibility of stranded assets, said Jonathan Grant, director of sustainability and climate change at PwC.
“Resilience will become a watchword in the boardroom – to policy responses as well as to the climate,” he said. “More radical and disruptive policy reactions in the medium term could lead to high-carbon assets being stranded.
“The new reality is a much more challenging future in terms of planning, financing and predictability,” Grant added. “The challenge now is to implement gigatonne-scale reductions across the economy, in power generation, energy-efficiency, transport and industry, as well as REDD+ in forested nations.”
Or, until that account is unsuspended by the forces supporting Donald Trump: Follow @FillmoreWhite, the account of the Millard Fillmore White House Library
We've been soaking in the Bathtub for several months, long enough that some of the links we've used have gone to the Great Internet in the Sky.
If you find a dead link, please leave a comment to that post, and tell us what link has expired.
Thanks!
Retired teacher of law, economics, history, AP government, psychology and science. Former speechwriter, press guy and legislative aide in U.S. Senate. Former Department of Education. Former airline real estate, telecom towers, Big 6 (that old!) consultant. Lab and field research in air pollution control.
My blog, Millard Fillmore's Bathtub, is a continuing experiment to test how to use blogs to improve and speed up learning processes for students, perhaps by making some of the courses actually interesting. It is a blog for teachers, to see if we can use blogs. It is for people interested in social studies and social studies education, to see if we can learn to get it right. It's a blog for science fans, to promote good science and good science policy. It's a blog for people interested in good government and how to achieve it.
BS in Mass Communication, University of Utah
Graduate study in Rhetoric and Speech Communication, University of Arizona
JD from the National Law Center, George Washington University


 Posted by Ed Darrell
 ")


