Annals of Global Warming: 2016 looks to be hottest year ever

November 19, 2016

Chart from Climate Central: The running average of global temperatures throughout 2016 compared to recent years. Each month shows the average of that month's temperature and each month before it

Chart from Climate Central: The running average of global temperatures throughout 2016 compared to recent years. Each month shows the average of that month’s temperature and each month before it

Earth is nearing the end of the the third record-breaking hot year in a row. 2014 was the hottest year ever, but was beaten by 2015. Now 2015’s heat takes second place to 2016’s heat.

2016’s record-breaking heat too fuel in part from an El Nino through the first nine months of the year; with a La Nina weather pattern developing now, there will be some cooling, but the cooling will not be enough to keep 2016 from being the warmest year ever recorded in human history.

Notes on this milestone can be found in several places; Climate Central’s explanation covers it succinctly.

The National Oceanic and Atmospheric Administration released its temperature data through the end of October on Thursday and found that for the year-to-date, the global average temperature is 1.75°F above the 20th century average of 57.4°F. That puts the year 0.18°F ahead of last year, the current hottest year titleholder, with just two months to go.

“It’s likely that we will end up as record warmest,” Jessica Blunden, a climate scientist with NOAA’s National Centers for Environmental Information, said during a press teleconference.

October itself tied as the third warmest in 136 years of record-keeping, coming in at 1.31°F (0.73°C) above the 20th century average of 57.1°F, according to NOAA. (NASA, which uses a different baseline and slightly different methods, put October in second place.)

September was the first month of the year to not be record warm (it came in second place), as temperatures began to cool slightly with the demise of El Niño and the move toward La Niña. It ended a streak of 16 consecutive record-setting months, itself a record.

Maybe more shocking, it’s been 115 years since we had a record cold year, according to Climate Central.

In fact, global temperatures have been above-average for 382 months in a row by NOAA’s reckoning, going all the way back to the Reagan administration. To find a record cold month requires going all the way back to February 1929. The last record-cold year was even further back, in 1911.

382 months. Anyone under the age of 31 has never experienced a single month of temperatures as low as the 20th century average, in their lifetime. A generation has been raised with global warming climate change as the norm. How will that affect voting patterns and public opinion to change government policies?

More:

Caption from Discover Magazine's ImaGeo blog: A map of temperature anomalies during October 2016 shows that the Arctic region was much warmer than the 1951-1980 mean. The United States and North Africa were also particularly warm. The largest area of cooler than average temperatures stretched across Russia. (Source: NASA GISS)

Caption from Discover Magazine’s ImaGeo blog: A map of temperature anomalies during October 2016 shows that the Arctic region was much warmer than the 1951-1980 mean. The United States and North Africa were also particularly warm. The largest area of cooler than average temperatures stretched across Russia. (Source: NASA GISS)


Global Warming is on the ballot; Bill Nye urges voting wisely

November 2, 2016

Bill Nye told Business Insider voters in 2016 can make a huge change, just voting for a president who will work on climate change.

Bill Nye told Business Insider voters in 2016 can make a huge change, just voting for a president who will work on climate change.

No secret that Bill Nye wants governments to act to slow and stop global warming.

Nothing if not hopeful, Nye explained to Mother Jones earlier that electing a president dedicated to making change could push Congress off the dime:

Electing a climate-friendly president is key, Nye says, because it could inject new life into Congress’ long-stagnant climate debate. “There are…many very reasonable people in Congress who are playing the hand they are dealt with these gerrymandered congressional districts,” he adds. “They have to please an extraordinary minority.” With the right leadership and timing, he says, the politicians just might take action.

A candidate rational about science and climate change is likely to be rational on other issues, too.

More:

Save

Save


Annals of Global Warming: XKCD explains warming over the eons

September 13, 2016

XKCD often makes us think; the strip’s forays into science and social policy often rank near the top of my personal list of salient and clear educational devices on tough issues.

Here’s a timeline of Earth’s average atmospheric temperature, going back a few years before your mother was born (though she was born a long, long time ago!).

See where this is headed? No one else has done it much better.

I did wonder when I saw this earlier, on September 12: Did the creator of XKCD learn this stuff in Edward Tufte’s course?

Earth Temperature Timeline, From XKCD, September 2016

Earth Temperature Timeline, From XKCD, September 2016

Save


40 years since the Big Thompson River disaster; do not forget

August 1, 2016

With 1000-year flooding having killed two in Ellicott City, Maryland, over the weekend, we should be reminded that delugic rains may increase with global warming.

And we should remember the Big Thompson River flood of July 31, 1976, and its victims.http://www.startribune.com/heating-up-this-week-raging-case-of-weather-amnesia/388762331/

Via the Paul Douglas on Weather blog at the Minneapolis Star-Tribune (one of America’s great newspapers):

[Thunderhead that produced a slow-moving, and consquently more catastrophic deluge in the headwaters of the Big Thompson River, Colorado, on July 31, 1976.]

[Thunderhead that produced a slow-moving, and consquently more catastrophic deluge in the headwaters of the Big Thompson River, Colorado, on July 31, 1976.]

The Big Thompson Disaster: Reverberations of a Flash Flood, 40 Years Later. Dr. Jeff Masters has the post at WunderBlog: “What began as a celebratory Saturday in the mountains ended in tragedy 40 years ago this weekend, when a catastrophic flash flood ripped through the narrow Big Thompson Canyon of Colorado’s Front Range. A total of 144 people were killed on that Saturday evening, July 31, 1976–the eve of the 100th anniversary of Colorado’s statehood. On just about any summer weekend, the canyons northwest of Denver are packed with vacationers and day-trippers. With the state’s centennial falling on this particular weekend, the mood was especially festive, and the weather seemed no more threatening than on many other summer days. Forecasts through the day called for a 40% to 50% chance of showers and thunderstorms, but there was no particular concern about flood risk. Only a few hours later, critical gaps in weather data, communication, and public awareness had teamed up with a slow-moving deluge to create a true disaster–one that’s had a noteworthy influence on how we deal with flash floods today….”

Image credit: NOAA.

Hiking in the area recently, in a different canyon, I reflected on the tremendous changes in weather forecasting in the past 40 years. A lot of warnings about flash floods, and paths to climb up the canyon in emergencies. Plus, we had constant weather updates. Big Thompson was just one of several flood disasters in the 1970s, Masters notes. It’s worth reading his full post.

139 bodies were recovered from the flood, but many other bodies were never recovered. People died from injuries of being tossed about by the flood, and colliding with rocks and trees. Few died of drowning.

How do we prepare to survive and avoid such disasters in the future?

Save

Save


Global warming changes local bird populations, matching scientists’ predictions

April 3, 2016

Phys.org caption: The American robin, a familiar species across much of continental USA, has declined in some southern states such as Mississippi and Louisiana, but increased in north-central states, such as the Dakotas. Credit: US Fish & Wildlife Service

Phys.org caption: The American robin, a familiar species across much of continental USA, has declined in some southern states such as Mississippi and Louisiana, but increased in north-central states, such as the Dakotas. Credit: US Fish & Wildlife Service Read more at: http://phys.org/news/2016-03-strong-effects-climate-common-bird.html#jCp

Most serious birdwatchers can tell you about global warming and climate change, just from watching the birds at their feeders, and when those birds migrate.

Now comes a study to confirm with data and controlled observation what the birders have been saying all along. Phys.org reported:

Scientists have shown for the first time that common bird populations are responding to climate change in a similar pronounced way in both Europe and the USA.

An international team of researchers led by Durham University, UK, found that populations of bird species expected to do well due to climate change had substantially outperformed those expected to do badly over a 30 year period from 1980 to 2010.

The research, conducted in collaboration with the RSPB and the United States Geological Survey (USGS), is published in the journal Science.

It is the first real demonstration that climate is having a similar, large-scale influence on the abundance of common birds in widely separated parts of the world, the researchers said.

Among the species showing pronounced effects of climate change are common woodland and garden birds such as the wren, in Europe, and the American robin in the USA.

(Read more at: http://phys.org/news/2016-03-strong-effects-climate-common-bird.html#jCp)

Biologists especially work to predict effects of warming on plants and animals, both to help plan changes in activities such as farming and hunting, and to protect species that are endangered now, or are likely to become so due to changing climate factors.

This study shows scientists can predict with accuracy some of the wildlife effects.

These changes are consistent with changing climate suitability within those areas, the researchers said.

Other factors, such as the size of the birds, the habitats they live in and their migratory behaviour, all affect , but did not differ systematically between groups advantaged or disadvantaged by climate change.

Therefore, only climate change could explain the differences between average population trends in advantaged and disadvantaged groups, the researchers said.

The study’s lead authors, Dr Stephen Willis and Dr Philip Stephens, of Durham University’s School of Biological and Biomedical Sciences, said the findings showed there was a large-scale, consistent response by bird populations to climate change on two continents.

The study was published in the April 1, 2016 issue of Science, “Consistent response of bird populations to climate change on two continents.

Science  01 Apr 2016:
Vol. 352, Issue 6281, pp. 84-87
DOI: 10.1126/science.aac4858

Tip of the old scrub brush to Svein T veitdal:


What is global warming? Great explanation, in 3 minutes

December 24, 2015

Katharine Hayhoe, climate scientist, image from NOVA's "Secret Life of Scientists"

Katharine Hayhoe, climate scientist, image from NOVA’s “Secret Life of Scientists”

Katharine Hayhoe, the evangelical Christian who studies climate change, explained global warming at Facebook, in an Earth video she made with Lazy Chief:


Why not a price on carbon, a tax with cap-and-trade capabilities?

October 29, 2015

Tax on air pollutants with a cap-and-trade process worked wonders cleaning up acid rain in the U.S.  Is there any rational reason to oppose such a plan, in the U.S. or anywhere else, to help clean up carbon air pollution to slow or stop global warming?

Germany’s Chancellor Angela Merkel issued a call for a carbon pricing system. Who will listen?

It’s a feature story from World Bank, who seems to have figured out that global warming poses great threats to commerce and growing the world’s economies.

Heads of State, City, Regional and Business Leaders Unite to Call for Price on Carbon

October 19, 2015

For the first time Heads of State, city and provincial leaders have come together with the support of leading companies to urge countries and companies around the world to put a price on carbon pollution.

For the first time Heads of State, city and provincial leaders have come together with the support of leading companies to urge countries and companies around the world to put a price on carbon pollution.


STORY HIGHLIGHTS
  • Carbon pricing is a key building block to tackle climate change and drive investment in a low carbon future.
  • Launched today, the Carbon Pricing Panel is an unprecedented alliance of Global Leaders united to put a price on carbon pollution.
  • The number of implemented or scheduled carbon pricing instruments has nearly doubled since 2012, reaching an aggregate market value of about $50 billion.

What can be done to reduce greenhouse gas emissions, protect our environment, and help support people most vulnerable to climate change?

The answer is simple: A key element for any strategy to tackle climate change must be to put a price on carbon pollution. The transition to a cleaner future requires government action and the right incentives. Carbon pricing is a key building block to help cut pollution and drive investment in a low carbon future.

It’s a point recognized by leaders from Europe, across to Africa and Asia, who have today – for the first time – come together with the support of leading private companies to urge countries and businesses around the world to put a price on carbon.

Convened by World Bank Group President Jim Yong Kim and the International Monetary Fund’s Managing Director Christine Lagarde, the high-level Carbon Pricing Panel is calling on their peers to follow their lead and put a price on carbon. They are joined in this effort by OECD Secretary General Angel Gurria.

The call by the leaders comes on the first day of the last round of negotiations ahead of the Paris climate talks in December. The leaders aim to seize the momentum generated by the Paris talks to spur further, faster action towards carbon pricing, as a necessary path to a low carbon, productive, competitive economy of the future.

Members of the Carbon Pricing Panel include German Chancellor Angela Merkel, Chilean President Michelle Bachelet, French President François Hollande, Ethiopian Prime Minister Hailemariam Desalegn, Philippines President Benigno Aquino III, Mexican President Enrique Peña Nieto, Governor Jerry Brown of California, and Mayor Eduardo Paes of Rio de Janeiro.

Private sector support is spearheaded by Anne Stausboll, CEO of US Institutional Investor CalPERS, Gérard Mestrallet, CEO of ENGIE of France, Anand Mahindra, Chairman and Managing Director of Mahindra Group of India, and Feike Sijbesma, Chairman and CEO of Netherlands-based Royal DSM.


” There has never been a global movement to put a price on carbon at this level and with this degree of unison. It marks a turning point from the debate on the economic systems needed for low carbon growth to the implementation of policies and pricing mechanisms to deliver jobs, clean growth and prosperity. The science is clear, the economics compelling and we now see political leadership emerging to take green investment to scale at a speed commensurate with the climate challenge. “

ImageJim Yong Kim
World Bank Group President

Summary map of existing, emerging and potential regional, national and sub-national carbon pricing instruments (ETS and tax)

Summary map of existing, emerging and potential regional, national and sub-national carbon pricing instruments (ETS and tax)


Around the world, about 40 nations and 23 cities, states and regions have implemented or are putting a price on carbon with programs and mechanisms covering about 12 percent of global greenhouse gas emissions.

The number of implemented or scheduled carbon pricing instruments has nearly doubled since 2012, reaching an aggregate market value of about $50 billion.

And already more than 400 businesses around the world are using a voluntary, internal price on carbon as part of their investment strategies, with prices ranging from US$4 to over US$100 per ton of CO2. This is a tripling in the number of companies compared with last year reporting that they price their emissions.

Carbon pricing delivers a triple dividend.

Firstly, it is good for the environment and it reduces emissions – lowering social costs of health impacts on people, as well as tackling the global warming.  A price on carbon can help alleviate health and environmental problems like premature deaths from exposure to outdoor air pollution. According to the World health Organization, an estimated 3.7 million people die prematurely from outdoor air pollution.

Secondly, carbon pricing is an essential part of getting prices right for the move to a low carbon more resilient growth. It raises revenue efficiently, making it possible to reduce more distortionary taxes, and it allows for targeted support for clean energy solutions rather than harmful subsidies that do little for poor people or the environment.

And thirdly, it drives innovation and critically needed investments in low-carbon solutions, boosting private sector investment in clean tech research and development, and offering the prospect of job creation in the sectors of the future.

Why is is it important to act now on carbon pricing? Because strong public policy gives the private sector the certainty and predictability to make the necessary long-term investments in climate-smart development and prevent catastrophic impacts from climate change. Carbon pricing is the cornerstone of a package of policy measures designed to achieve emission reductions at lowest cost.

Today, countries and regions are learning from one another and creating a set of successful approaches to pricing carbon. Some early lessons are described in the World Bank Group publication The FASTER Principles for Successful Carbon Pricing – which lays out principles for effective, efficient and fair pricing of carbon.

Some examples include:

  • The Canadian province of British Columbia was an early mover on carbon pricing, with the creation of a carbon tax in 2008, with the tax used to cut income taxes and fund tax credits. Also, British Columbia is home to a growing clean technology sector, with more than 150 firms in 2013, accounting for 22% of Canada’s clean tech presence in a province with only 12% of Canada’s GDP. Several experts attribute this growth to the carbon tax.
  • California, Quebec and the European Union allocate a portion of their emissions trading scheme (ETS) auction revenues to designated green technology funds and innovation, to support sectors affected directly or indirectly by higher carbon costs.
  • In Chile, the government has passed legislation on a carbon tax – effective as of 2017 – as part of a much larger tax reform package with the explicit aim of providing additional resources for education and other social protection programs.
  • In Northeastern United States, the Regional Greenhouse Gas Initiative is expected to save people money on energy bills. The RGGI states have invested over $1 billion from ETS proceeds in energy-efficiency program, which are expected to return more than $2.3 billion in lifetime energy bills savings to 1.2 million participating households. Also, from 2008-2012, RGGI invested more than $130 million to help energy and electricity customers in need.

The high level panel provides political momentum to complement the voices of government and industry leaders in the Carbon Pricing Leadership Coalition (CPLC), a working coalition that is being formed on the back of support for carbon pricing from 74 countries and 1,000 companies, at the 20014 UN summit on climate change.

Putting a price on carbon can be done in many ways: using an emissions trading system (ETS), like the one in Europe, or introducing carbon taxes and fees, like in Sweden and Norway. Most importantly, the “polluter pays” principle applies – those who are responsible for the pollution face the cost of it.


Annals of global warming: Would you worry if it shrinks your paycheck?

October 26, 2015

Then worry.

Scientists estimate the impact of climate change on the world economy  - Nature

Scientists estimate the impact of climate change on the world economy, change in GDP per capita by 2100, compared to a world without climate change. – from Nature Magazine via MarketWatch

MarketWatch’s Silvia Ascarelli wrote:

Your grandchildren may pay a bigger price for global warming than you thought.

A hotter Planet Earth will cool down national economies, according to fresh research from scientists at Stanford University and the University of California, Berkeley.

Average U.S. income could shrink 36% by 2100 because of climate change from what it would be without global warming, they say. That is more than other, earlier studies have suggested.

But not all countries will suffer. Russia, Canada and countries in Northern Europe should benefit from warmer temperatures, according to the scientists’ models, because they have yet to reach what the scientists called the optimal average temperature for an economy — 55 degrees Fahrenheit, roughly where the U.S. is now.

“We were surprised at how important temperature is for the global economy,” said Solomon Hsiang, an associate professor of public policy at Berkeley and one of the co-authors of the study along with Marshall Burke, an assistant professor in earth system science at Stanford, and Edward Miguel, Oxfam professor in environmental and resource economics at Berkeley.

Global per capita gross domestic product will be down 23% at the turn of the next century if global warming isn’t slowed, the study found. The impact will be more severe in China — average income will shrink 43%—and Mexico, where average income could plunge 73%.

More at MarketWatch.

Should we worry? Can we afford global warming?


Beautiful photograph; but where are the glaciers?

October 6, 2015

Stupendous photo of evening advancing on Glacier National Park.

The Wilderness Society Tweeted out this shot of Glacier National Park (I cannot read the photographer to whom credit belongs).

The Wilderness Society Tweeted out this shot of Glacier National Park (I cannot read the photographer to whom credit belongs). “Wow. Outstanding sky over @GlacierNPS.”

I know. It’s summer. But still I wonder, where are the glaciers? Where did they go?


Annals of Global Warming: Warm the oceans, raise the sea level

September 15, 2015

Svein T veitdal is one of those rare scientists who can explain why science observations are important in effects on people in just living their lives. A good man to listen to (you can follow his Twitter account: @tveitdal).

Recently he sent this notice:

Critics of the science of climate change and the work to slow or halt warming don’t like charts like that. Sea level is something measured by humans, worldwide, for a long time. That’s real data.

And it’s scary.

T veitdal’s Tweet was just a small part of a very large graphic from NASA, explaining the observations that tell us sea levels rise, how the observations are made, and what it means to you and me.

NASA infographic on sea level rise

NASA infographic on sea level rise: We know seas are rising and we know why. The urgent questions are by how much and how quickly. Available to download, this infographic covers the science behind sea level rise, who’s affected, how much melting ice is contributing, and what NASA is doing to help.

Yeah. “Your planet is changing. We’re on it.”

As Ban-ki Moon said the other day, there is no Planet B. We have only one Earth.

General science teachers, geology teachers, physics and chemistry teachers, history, geography and human geography teachers should see if someone at your school has a plotter and can print this thing out for you, poster size.


Annals of Global Warming: A roadmap to the UN climate change treaty process

August 25, 2015

Alas, the U.S. has led a large contingent off-road.

From the Cut the Fluff blog:

A quick flick back in recent time to take a look at the United Nations Framework Convention on Climate Change in one mapped infographic via The Climate Group.

A quick flick back in recent time to take a look at the United Nations Framework Convention on Climate Change in one mapped infographic via The Climate Group.

If you stop the average climate change action opponent on the street (as many as 25 out of every 100 people, or every other person in Texas in my unscientific sample) they will be able to tell you they think scientists are all liars making big money off of scamming citizens and businesses, and that there is big money to be made in faking research. But they cannot seriously describe evidence to back their claims, nor can they describe the history of international work to stop human-caused warming.

As you might imagine, they cannot discuss the pending meetings in Paris, either. Heck, most scientists and well-informed people can’t explain the meetings, either.

I hope this helps.

“COP” and “UNFCC” are UN acronyms for Conference of the Parties to the United Nations Framework Convention on Climate Change.

The Sustainable Information Forum (SIF15) explains the Paris Conference In not-too-turgid prose:

COP – What’s it all about?

The international political response to climate change began at the Rio Earth Summit in 1992, where the ‘Rio Convention’ included the adoption of the UNFCCC. This convention set out a framework for action aimed at stabilising atmospheric concentrations of greenhouse gases (GHGs) to avoid “dangerous anthropogenic interference with the climate system.” The UNFCCC which entered into force on 21 March 1994, now has a near-universal membership of 195 parties.

The main objective of the annual Conference of Parties (COP) is to review the Convention’s implementation. The first COP took place in Berlin in 1995 and significant meetings since then have included COP3 where the Kyoto Protocol was adopted, COP11 where the Montreal Action Plan was produced, COP15 in Copenhagen where an agreement to success Kyoto Protocol was unfortunately not realised and COP17 in Durban where the Green Climate Fund was created.

In 2015 COP21, also known as the 2015 Paris Climate Conference, will, for the first time in over 20 years of UN negotiations, aim to achieve a legally binding and universal agreement on climate, with the aim of keeping global warming below 2°C.

France will play a leading international role in hosting this seminal conference, and COP21 will be one of the largest international conferences ever held in the country. The conference is expected to attract close to 50,000 participants including 25,000 official delegates from government, intergovernmental organisations, UN agencies, NGOs and civil society.

Now you know, I hope.

More:


Annals of global warming: Time to change maps of Arctic ice

August 11, 2015

National Geographic Society reminded us they’ve had to change maps of the arctic.

National Geographic Society composed this GIF to compare their maps over past 16 years: A GIF of National Geographic atlases from 1999 through 2014 shows how Arctic ice has melted over time.

National Geographic Society composed this GIF to compare their maps over past 16 years: A GIF of National Geographic atlases from 1999 through 2014 shows how Arctic ice has melted over time.

President Barack Obama noted the change in his announcement of U.S. actions to fight climate change. National Geo added details beyond what the president said.

As the ocean heats up due to global warming, Arctic sea ice has been locked in a downward spiral. Since the late 1970s, the ice has retreated by 12 percent per decade, worsening after 2007, according to NASA. May 2014 represented the third lowest extent of sea ice during that month in the satellite record, according to the National Snow and Ice Data Center (NSIDC).

Ice loss is accelerated in the Arctic because of a phenomenon known as the feedback loop: Thin ice is less reflective than thick ice, allowing more sunlight to be absorbed by the ocean, which in turn weakens the ice and warms the ocean even more, NASA says.

Because thinner ice is flatter, it allows melt ponds to accumulate on the surface, reducing the reflectiveness of the ice and absorbing more heat. (See pictures of our melting world in National Geographic magazine.)

“You hear reports all the time in the media about this,” Valdés said. “Until you have a hard-copy map in your hand, the message doesn’t really hit home.”

(More at National Geo’s site.)

At the last edition of the National Geographic Atlas, a video described why and how changes were made.

We used to think the old Earth was so massive, little could humans do to change it. While it’s probably still true the rock will survive after humans are extinct, we now know we can foul our nest enough to make it uncomfortable, or impossible for our species to stay here.

Global warming is changing the planet. Maps must be changed to show the new face.

Have we acted soon enough, and hard enough to save space for humans to live?

Tip of the old scrub brush to Chris Tackett on Twitter.


Are those flames? Is that fiddle music I hear? Greenland is melting faster (Annals of Global Warming)

July 28, 2015

Discover Magazine caption: Greenland as seen by NASA’s Aqua satellite on June 29, 2015. (Source: NASA Worldview)

Discover Magazine caption: Greenland as seen by NASA’s Aqua satellite on June 29, 2015. (Source: NASA Worldview)

What is the price of our delay?

Greenland’s ice is melting faster than scientists predicted a few years ago. Incredibly, a sizable bloc of people work to stop action against climate change, claiming that it’s not occurring, or that it’s natural and shouldn’t be stopped, or that we can’t afford to save the planet this time.

Polar oceanographer Mark Brandon calls our attention to a good lay article in Discover Magazine’s .blog Imageo, by Tom Yulsman:

As brutal heat grips parts of Europe, Asia, North America and South America, another place is also experiencing a spike in temperatures — one that you may not have heard about.

It’s happening in Greenland, and high temperatures there over the past two weeks have caused a sudden jump in melting at the surface of the vast ice sheet (seen in that great expanse of white in the satellite image above).

Science critics argue the warming is slowing down, and will soon stop. Wish they were right. 18 years of their being wrong makes me skeptical.

Caption from ImaGeo: In the graph above, the red line traces a sudden increase in the extent of surface melting in Greenland. (Source: National Snow and Ice Data Center)

Caption from ImaGeo: In the graph above, the red line traces a sudden increase in the extent of surface melting in Greenland. (Source: National Snow and Ice Data Center)

In the meantime, as Galileo might have said, “Eppure, lei si scalda!”still, she warms.

More:

Greenland is Melting, band graphic

Greenland is Melting, band graphic


National Parks timelapse movie, “The Untouched”

July 27, 2015

Title shot from "The Untouched," a movie of time-lapse shots of U.S. National Parks.

Title shot from “The Untouched,” a movie of time-lapse shots of U.S. National Parks.

The Wilderness Society said:

This filmmaker traveled to 30 states and national parks to capture this gorgeous time-lapse video showcasing the beauty of untouched nature and our dark skies

Watch the video and read the account of all that goes into making a film like this. Amazing work!

From .  Details at Vimeo, where Manievannan discusses what the Parks showed of destructive climate change during the filming.

How many places can you identify? How many of them have you visited?

More:


Wind power ready for its closeup?

June 27, 2015

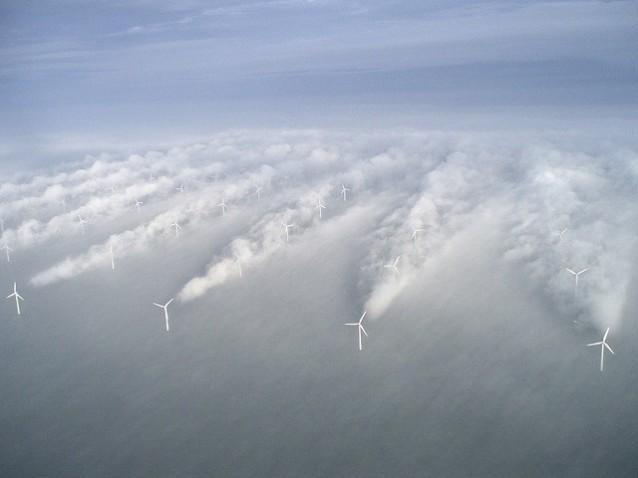
Climate Progress used this photo in a Tweet touting Denmark’s wind power progress:

Denmark sets world record for wind power production http://thkpr.gs/3608898   (No other photo information in Tweet)

Denmark sets world record for wind power production http://thkpr.gs/3608898 (Photo credit: flickr/Vattenfall)

Awesome photograph, a 21st century version of those photos of men, machines, bridges and other industrial objects admired for their symmetry and sharp shadows from the 1920s and 1930s. I would guess it was captured by an airplane passenger passing over the at-sea windfarms springing up around Europe’s Atlantic Coast, off the coast of Denmark, if Climate Progress editors were careful.

Scientifically, the photo shows what happens when windmills reduce the air pressure downwind of the blades — condensation can suddenly become visible.  Condensation trails from windmills (won’t that vex the hell out of chemtrails tinfoil hatters?).

The photo illustrates what should be good news:

Denmark has been long been a pioneer in wind power, having installed its first turbines in the mid-1970s when oil shocks sent the import-dependent nation on a quest for energy security. Thirty-seven years later, the country has set a new world record for wind production by getting 39.1 percent of its overall electricity from wind in 2014. This puts the Northern European nation well on track to meet its 2020 goal of getting 50 percent of its power from renewables.

The news of Denmark’s feat adds to the national records the U.K. and Germany set for 2014 and further establishes Europe as a leader in the wind power industry. This is especially true when it comes to offshore resources, as countries like Scotland, England, and Denmark build out their offshore wind farms. Wind generated enough electricity to power just over 25 percent of U.K. homes in 2014 — a 15 percent increase from 2013. In December, Germany generated more wind power, 8.9 terawatt-hours, than in any previous month.

A big source of the surge of Denmark’s wind production this year came from the addition of around 100 new offshore wind turbines. In January of 2014, the peninsular country got just over 61 percent of its power from wind. This is more than three times the overall production of 10 years ago, when wind only made up 18.8 percent of the energy supply. The country has a long-term goal of being fossil fuel-free by 2050.

Anti-greens, and rational conservationists, see trouble though. Anti-greens holler that the windmills “kill birds,” as if the coal power plants the windmills displace do less environmental damage.  They will bring this up in every discussion of alternative energy sources, and in every discussion of working to reduce carbon dioxide emissions to decrease pollution and damage from climate change.  I suppose they want us to throw up our hands and give up on conservation.  (Industry agents like CFACT have no compunction against giving half-truths on these issues.)

Conservationists, like Chris Clarke, see the dangers.  Bird kills do occur at wind farms, in greater numbers than any conservationist is comfortable with.  Off-shore wind farms could hammer migrating populations of songbirds and other migratory fowl, in addition to the sea-dwelling birds.  Few solid studies on bird damage exist.  We are particularly the dark about the songbirds, who migrate in enormous avian clouds at night.  An article in Nature sums up issues:

Wind turbines kill far fewer birds in general each year than do many other causes linked to humans, including domestic cats and collisions with glass windows. But wind power has a disproportionate effect on certain species that are already struggling for survival, such as the precarious US population of golden eagles (Aquila chrysaetos canadensis).

“The troubling issue with wind development is that we’re seeing a growing number of birds of conservation concern being killed by wind turbines,” says Albert Manville, a biologist with the US Fish and Wildlife Service in Arlington, Virginia.

It is good news that wind power can replace fossil fuels. But industrial-sized enterprises inherently create environmental problems. Our policy makers need to be alert to the issues involved, and create incentives for development of alternative energy sources that will prevent our falling into the rut of industrial development that comes at enormous costs pushed to future generations.

Who is looking out for the birds? Can there be anyone who argues we should give up on climate change because of problems from alternative energy, really?

Chris Clarke tells us the problems, that we need accurate, relevant information, and we don’t have a methodical process to get it:

The issue of eagles being harmed by wind turbines in the U.S. is a huge topic, to put it mildly. And yet a paper documenting two eagle mortalities at a wind turbine facility in the last 20 years is “conceptually novel” enough to merit publication in a prestigious wildlife science journal.

Put it this way: The scientific community has more information on deaths among marine mammals, which spend much of their time in places it’s hard for us to get to, than it does about injuries and deaths to rather conspicuous birds in industrial facilities. Hell, we have better, more solid data on planets outside our solar system than we do on eagle mortalities at wind energy plants in California.

One could ask the rhetorical question “why is that the case,” but it’s almost a waste of time: it’s because wind energy companies would strongly prefer that data never gets released to the public.

And that’s what peer-reviewed journals are, for all their abstruse language and incomprehensible math and absurd paywalls: public information. Once that data gets analyzed and put in context by independent biologists, it becomes available to us all.

[USGS research ecologist Jeffrey] Lovich puts it this way:

Minimizing wildlife mortality at wind farms is a major goal of conservation, although research on how best to do that is in short supply. Compiling and publishing accurate data on mortality of Golden Eagles over time is an important first step in efforts to protect these iconic birds.

And doing so in the clear light of day is crucial if we in the public are ever to make scientifically sound decisions about our energy policy, regardless of whether we put windpower or wildlife first.

Who will provide that information? Who will even ask for it? If we can’t get consensus on whether we should save humanity’s home on Earth, how can we get consensus on asking the questions about how to go about it, and how to learn how to do it?