
jordanfhiggins More good advice. #NASASocial
Sometimes signs just don’t command the attention they should.
jordanfhiggins More good advice. #NASASocial
Sometimes signs just don’t command the attention they should.
 2 Comments |
  Humor, NASA, Safety, Signs | Tagged: Humor, NASA, Safety, Signs |
  Permalink
 Posted by Ed Darrell
Photo and press release from NASA’s Earth Observatory:

Image from the astronauts aboard the International Space Station, acquired August 18, 2013 — 50 mm lens. Looking to the west, over Idaho. See photo below for labels of fire sites.
Description of the photo:
Taken with a short lens (50 millimeters), this west-looking image from the International Space Station includes much of forested central Idaho. The oblique image highlights part of the largest single wilderness area in the contiguous United States, the Frank Church–River of No Return Wilderness.
Within this mountainous region (the dark areas are all wooded), several fires produced extensive smoke plumes. The densest smoke appeared to be generated by a combination of the Little Queens and Leggit fires (within the Salmon River Mountains [link added]). This image shows the common pattern of westerly winds carrying smoke in an easterly direction, as seen during the wildfire season of one year ago.
Named fires—most ignited by lightning—had burned 53,000 acres of forest south of the Salmon River by August 20, 2013; the number would be significantly higher if unnamed fires were included. The Gold Pan fire, north of the Salmon River, had burned 27,000 acres. For a sense of scale, Gold Pan lies about 125 miles (200 kilometers) north of the Little Queens fire.
Ten days before this image was taken, fires in central Idaho (near Boise) had been aggravated by southerly winds. Some of those fires began to burn in July, but were quelled and remain under observation for new flare-ups.
In the image above, smoke partly obscures the black lava flows of the Craters of the Moon National Monument [link added] (lower left). The Beaverhead Mountains [link added] mark the eastern boundary of Idaho with Montana.
Astronaut photograph ISS036-E-32853 was acquired on August 18, 2013, with a Nikon D3S digital camera using a 50 millimeter lens, and is provided by the ISS Crew Earth Observations experiment and Image Science & Analysis Laboratory, Johnson Space Center. The image was taken by the Expedition 36 crew. It has been cropped and enhanced to improve contrast, and lens artifacts have been removed. The International Space Station Program supports the laboratory as part of the ISS National Lab to help astronauts take pictures of Earth that will be of the greatest value to scientists and the public, and to make those images freely available on the Internet. Additional images taken by astronauts and cosmonauts can be viewed at the NASA/JSC Gateway to Astronaut Photography of Earth. Caption by M. Justin Wilkinson, Jacobs/JETS at NASA-JSC.
Salmon River Mountains, Idaho, on the ground; notice the steep mountains on-the-ground firefighters must contend with. Wikipedia image
Instrument: ISS – Digital Camera
My older brother Dwight was a firefighter with the Bureau of Land Management in the early 1960s. There were some huge fires then — but not so many, so large, all at once. While we don’t have satellite photos to compare from way back then, this is just scary. Those were scary on the ground, and smaller than these — and fewer.
Notice in the photo below, some of these huge fires are not even big enough to be named. Wow.

Image from the International Space Station of Idaho fires, with names of larger fires overlayed. August 23, 2013
More:
Compare with NASA photo from a month ago; Idaho’s been hammered by fire in 2013:

Photo of Idaho from about July 20, 2013, showing then-active fires in the state — north at top of photo. Notice Craters of the Moon National Monument, the dark area in the southeast section — this area is obscured by new fires in the photos above. Idaho’s borders are barely visible in a thin, black line. This photo from NASA/Goddard
Leave a Comment » | Disasters, History, NASA, National Wilderness Area, Nature, Wilderness | Tagged: Disasters, Forest Fires, Idaho, International Space Station, NASA, Nature, Wildfires | Permalink
Posted by Ed Darrell
It’s a day to remember history. Do you remember that day, the first time humans set foot on the Moon?
(This is based on an earlier post.)
Southwest Elementary in Burley, Idaho, existed in a world far, far away from the U.S. space program. We watched rocket launches on black and white televisions — the orbital launches were important enough my father let me stay home from school to watch, but when he dropped me off at school, I was in a tiny band of students who actually made it to school. Potato farmers and the merchants who supported them thought the space program was big, big stuff.
By John Glenn’s flight, a three-orbit extravaganza on February 20, 1962, a television would appear in the main vestibule of the school, or in the auditorium, and we’d all watch. There were very few spitballs. Later that year my family moved to Pleasant Grove, Utah.

Moonrise from Apollo 11 prior to Moon landing. For a QuickTime movie from NASA on the 30th anniversary of the landing, click here.
Toward the end of the Gemini series, television news networks stopped providing constant coverage. The launch, the splashdown, a space walk or other mission highlight, but the nation didn’t hold its breath so much for every minute of every mission. Barry McGuire would sing about leaving the planet for four days in space (” . . . but when you return, it’s the same old place.”), then six days, but it was just newspaper headlines.
The Apollo 1 fire grabbed the nation’s attention again. Gus Grissom, one of the three who died, was one of the original space titans; death was always a possibility, but the U.S. program had been so lucky. Apollo’s start with tragedy put it back in the headlines.
The space program and its many successes made Americans hopeful, even in that dark decade when the Vietnam War showed the bloody possibilities of the Cold War. That darkest year of 1968 — see the box below — closed nicely with Apollo 8 orbiting the Moon, and the famous Christmas Eve telecast from the three astronauts, Frank Borman, Jim Lovell, and William A. Anders. The space program kept us hopeful.
By early 1969 many of us looked forward to the flight of Apollo 11 schedule for July — the space flight that promised to put people on the Moon for the first time in history, the realization of centuries-old dreams.
But, then I got my assignment for Scouting for the summer — out of nearly 50 nights under the stars, one of the days would include the day of the space walk. Not only was it difficult to get televisions into Maple Dell Scout Camp, a good signal would be virtually impossible. I went to bed knowing the next day I’d miss the chance of a lifetime, to watch the first moon landing and walk.
Just after midnight my sister Annette woke me up. NASA had decided to do the first walk on the Moon shortly after touchdown, at an ungodly hour. I’d be unrested to check Scouts in, but I’d have seen history.
And so it was that on July 20, 1969, Neil Armstrong became the first human to set foot on the Moon: “A small step for a man, a giant leap for mankind,” was what he meant to say in a transmission that was famously garbled (at least he didn’t say anything about jelly doughnuts).

Photo: Astronaut Buzz Aldrin salutes the U.S. flag on the Moon; for a gallery of photos from Apollo 11 from NASA, click here.
2013 will mark the 44th anniversary.
Texas Essential Knowledge and Skills (TEKS) lists 11 dates for U.S. history as the touchstones kids need to have: 1609, the founding of Jamestown; 1776, the Declaration of Independence; 1787, the Constitutional Convention; 1803, the Louisiana Purchase; 1861-1865, the American Civil War; 1877, the end of Reconstruction; 1898, the Spanish American War; 1914-1918, World War I; 1929, the Stock Market Crash and beginning of the Great Depression; 1941-1945, World War II; 1957, the launching of Sputnik by the Soviets. Most teachers add the end of the Cold War, 1981; I usually include Apollo 11 — I think that when space exploration is viewed from a century in the future, manned exploration will be counted greater milestone than orbiting a satellite; my only hesitance on making such a judgment is the utter rejection of such manned exploration after Apollo, which will be posed as a great mystery to future high school students, I think.)
* 1968, in roughly chronological order, produced a series of disasters that would depress the most hopeful of people, including: the Pueblo incident, the B-52 crash in Greenland, the Tet Offensive in Vietnam, the nerve gas leak at the Army’s facility at Dugway, Utah, that killed thousands of sheep, Lyndon Johnson’s pullout from the presidential race with gathering gloom about Vietnam, the Memphis garbage strike, the assassination of Martin Luther King, Jr., riots, the Black Panther shoot out in Oakland, the Columbia University student takeover, the French student strikes, the tornadoes in Iowa and Arkansas on May 15, the Catonsville 9 vandalism of the Selective Service office, the sinking of the submarine U.S.S. Scorpion with all hands, the shooting of Andy Warhol, the assassination of Robert F. Kennedy, the Buenos Aires soccer riot that killed 74 people, the Glenville shoot out in Cleveland, the cynicism of the Republicans and the nomination of Richard Nixon and Spiro Agnew, the Warsaw Pact invasion of Czechoslovakia crushing the “Prague Spring” democratic reforms, the Chicago Democratic Convention and the police riot, the brutal election campaign, the Tlatololco massacre of students in Mexico City, Black Power demonstrations by winning U.S. athletes at the Mexico City Olympics, coup d’etat in Panama. Whew!
More, from Millard Fillmore’s Bathtub:
And even more:
1 Comment | 1957, 1968, 1969, Cold War, Heroes, History, Moon, Neil Armstrong, Science, Space exploration, Technology, TEKS | Tagged: Apollo 11, Buzz Aldrin, Gus Grissom, History, John Glenn, NASA, Neil Armstrong, Science | Permalink
Posted by Ed Darrell

President John F. Kennedy speaking to a special joint session of Congress, on May 25, 1961; in this speech, Kennedy made his famous statement asking the nation to pledge to put a man on the Moon and bring him back safely, in the next ten years.
It was an era when Congress would respond when the President challenged America to be great, and Congress would respond positively.
On May 25, 1961, President Kennedy delivered a special message to Congress, on the challenges facing the U.S. around the world, in continuing to build free market economies, and continuing to advance in science, as means of promoting America’s future. He closed with the words that have become so famous. From the Apollo 11 Channel, excerpts from the speech, via Fox Movietone news:
History from the Apollo 11 Channel:
In an address to a Joint session of the United States Congress, Kennedy announces full presidential support for the goal to “commit…before this decade is out, to landing a man on the Moon and returning him safely to the Earth” and urges Congress to appropriate the necessary funds, eventually consuming the largest financial expenditure of any nation in peacetime.
Though Kennedy had initially been convinced that NASA should attempt a manned mission to Mars, NASA Associate Administrator Robert Seamans spent three days and nights working, ultimately successfully, to convince him otherwise.
The complete speech is 46 minutes long. The JFK Library has a longer excerpt in good video I haven’t figured out how to embed here, but it’s worth your look. The Library also features the entire speech in audio format.
NASA has a good site with solid history in very short form, and links to a half-dozen great sites.
Can you imagine a president making such a challenge today?
More:
4 Comments | Cold War, Famous trials, History, Moon, NASA, Science, Space exploration, Space Race | Tagged: Cold War, famous speeches, History, John F. Kennedy, NASA, Science, Space exploration, Space Race, Turning Points | Permalink
Posted by Ed Darrell
This is mostly a reprise of a post from October, in which we noted that climate scientist James Hansen‘s off-handed prediction of what might be warming damage to New York had come true. Not that Hansen wanted it to ever occur, but Hansen’s conjecture had been the subject of great ridicule attempts in the warming [choose one: denialists’, critics’, apologists’s] Gish Gallop rebuttal attempts.
As it is again. This time, a discussant pointed the Anthony Watts’s Carnival of Misbelief as the source of a claim which, the discussant said, proved liberals don’t like facts.
Here’s the run-up question, and my response:
http://twitter.com/EdDarrell/status/336945436613038080
Mr. Mears tried to extend his argument:
http://twitter.com/dave_mears/status/336963677947301889
He should have quit at bafflegab. His link runs to Anthony Watts’s place, with the same attempted ridicule of James Hansen’s nightmare.
Watts made the same error Steve Goddard made, of course. Watts corrected one erroneous detail — the time in which Hansen said it might occur — but tried to make the ridicule stick:
As of this update in March 2011, we’re 23 years into his prediction of the West Side Highway being underwater. From what I can measure in Google Earth, Dr. Hansen would need at least a ten foot rise in forty years to make his prediction work. See this image below from Google Earth where I placed the pointe over the West Side Highway, near the famous landmark and museum, the USS Intrepid:
According to Google Earth, the West Side Highway is 10 feet above sea level here – click to enlarge
The lat/lon should you wish to check yourself is: 40.764572° -73.998498°
We turn to the events of last October, and the storm that was Hurricane Sandy, which slammed into New Jersey and New York, and that same West Side Highway.
I noted in an earlier post, on October 30 of last year:
No! Someone whose comments don’t show up at Steve Goddard’s blog? Must be some massive disruption in the force of the Tubes of the Interweb thingy.
What is this guy Tony on about?
At Steve Goddard’s blog — this is the same guy who said the western drought was over because Lake Powell rose a few feet, though the drought raged on everywhere else — Goddard and his flying and limping monkeys have been poking fun at something James Hansen is alleged to have said:
According to NASA’s top scientist, Manhattan has been underwater for the past four years, and is experiencing a horrific drought.
While doing research 12 or 13 years ago, I met Jim Hansen, the scientist who in 1988 predicted the greenhouse effect before Congress. I went over to the window with him and looked out on Broadway in New York City and said, “If what you’re saying about the greenhouse effect is true, is anything going to look different down there in 20 years?” He looked for a while and was quiet and didn’t say anything for a couple seconds. Then he said, “Well, there will be more traffic.” I, of course, didn’t think he heard the question right. Then he explained, “The West Side Highway [which runs along the Hudson River] will be under water. And there will be tape across the windows across the street because of high winds. And the same birds won’t be there. The trees in the median strip will change.” Then he said, “There will be more police cars.” Why? “Well, you know what happens to crime when the heat goes up.”
And so far, over the last 10 years, we’ve had 10 of the hottest years on record. [Quoting an article at Salon]
The West Side Highway under water? Ha.
Goddard’s blog has used Hansen’s quote as a regular punchline, not noticing that Hansen said “in 20 to 30 years,” and assuming he was just awfully, comically wrong. 30 years from 1988 will be 2018. This year is 2012, six years to go. Goddard tried to ridicule Hansen a few times over the past couple of years, for example:
AP may complain about this use, but this is an academic, learning exercise:

Caption from Yahoo! News: This photo provided by Dylan Patrick shows flooding along the Westside Highway near the USS Intrepid as Sandy moves through the area Monday, Oct. 29, 2012 in New York. Much of New York was plunged into darkness Monday by a superstorm that overflowed the city’s historic waterfront, flooded the financial district and subway tunnels and cut power to nearly a million people. (AP Photo/Dylan Patrick) MANDATORY CREDIT: DYLAN PATRICK
Dylan Patrick got the photographic evidence that shows, once again, warming denialists really are a classless, fact-lacking bunch. CNN has photos from Dylanphoto1 (the same guy, almost certainly), in a slide show, noting, “Most of the Westside Highway south of 49th street is flooded all the way down, and in front of the USS Intrepid.” Across from Pier 88 and the USS Intrepid, the street is indeed underwater.
So we learn that, as a comedian, Steve Goddard has an extremely limited range and depends on a sympathetic room to get laughs; and as a climate scientist, he is even more limited, and wrong, with 6 years to go in the 20 to 30 year range James Hansen offered. And we learn once again, sadly, that James Hansen was right back in 1988 when he hit the claxons to warn us of global warming.
23 times Goddard repeated the charge? Do you get the idea that “climate skeptics” ran out of material years ago, and have been dancing a cover-up for a very, very long time? Hurricane Sandy blew and floated his claim away.
In this reprise post, I add three photos to make it even more clear what happened:

From CNN: By dylanphoto1 | Posted October 29, 2012 | NYC, NY, New York — CNN PRODUCER NOTE dylanphoto1 told me, ‘It was fairly quiet with large gusts of wind and some rain. There were other people out and about taking photos and commenting on how crazy it is to see the water covering the highway. Cops were out chasing people off the highway.’
Yes, Dear Reader, that is indeed Pier 88. New Yorkers probably recognize it as the berthing place of the U.S.S. Intrepid, the same ship Watts shows in his photo, while laughingly promising that the West Side Highway would never be flooded by the ocean at that spot. Never?

CNN image, photo by dylanphoto1; in this view, Pier 88’s denizen, the U.S.S. Intrepid, can clearly be seen by the name on the stern of the ship.
One more photo from dylanphoto1:

At New York City’s Pier 88, the U.S.S. Intrepid, with the West Side Highway in the foreground, covered by surging and rising ocean waters.
So there you have it. Some conservatives will deny the science they claim to cling to, blaming liberals or James Hansen for being right all along.
Is this stuff from the anti-warms the Cargo Cult Science Dr. Feynman warned us about, do you think?
More (list from the October post):
Even more, a bit later:
And even more, from May 2013:
16 Comments | Climate change, climate_change, Global warming, History, NASA, Politics, Science | Tagged: Anthony Watts, Climate change, denialism, Global warming, History, Hurrican Sandy, James Hansen, NASA, Politics, Science, West Side Highway | Permalink
Posted by Ed Darrell

Oklahoma storm of May 20, 2013, as viewed by NASA Goddard’s Aqua satellite.
Residents of Moore got several minutes of warning before the tornado struck, saving perhaps hundreds of lives.
Can the U.S. afford to keep cutting resources from NASA and NOAA? Seriously?
Leave a Comment » | Government, History, NASA, NOAA, Science, Space exploration | Tagged: Government, NASA, NOAA, Science, Space exploration | Permalink
Posted by Ed Darrell
Wow.

Saturn, ready for its close up: Eclipse of the Sun by Saturn. NASA photo at Wikipedia
Sander van den Berg downloaded publicly-available images of Saturn and its moons and rings, and patched them together in make time-lapse movies.
This short feature will stun you; these are real images, not altered, only patched together to pixillate motion.
“Outer Space,” by Sander van den Berg:
van den Berg said the music is from the Cinematic Orchestra, “That Home (Instrumental).” Details on how he made the film at Vimeo.
Tip of the old scrub brush to Steve @vanesch, https://twitter.com/vanesch
More:
Leave a Comment » | Astronomy, NASA, Time-lapse photography | Tagged: Astronomy, Cassini, Cassini–Huygens, NASA, Sander van den Berg, Saturn, Science, Time-lapse, Voyager | Permalink
Posted by Ed Darrell
I just can’t see it.
The past two evenings, when it was supposed to be visible, we couldn’t find it. Maddeningly, others have great photos of the thing.
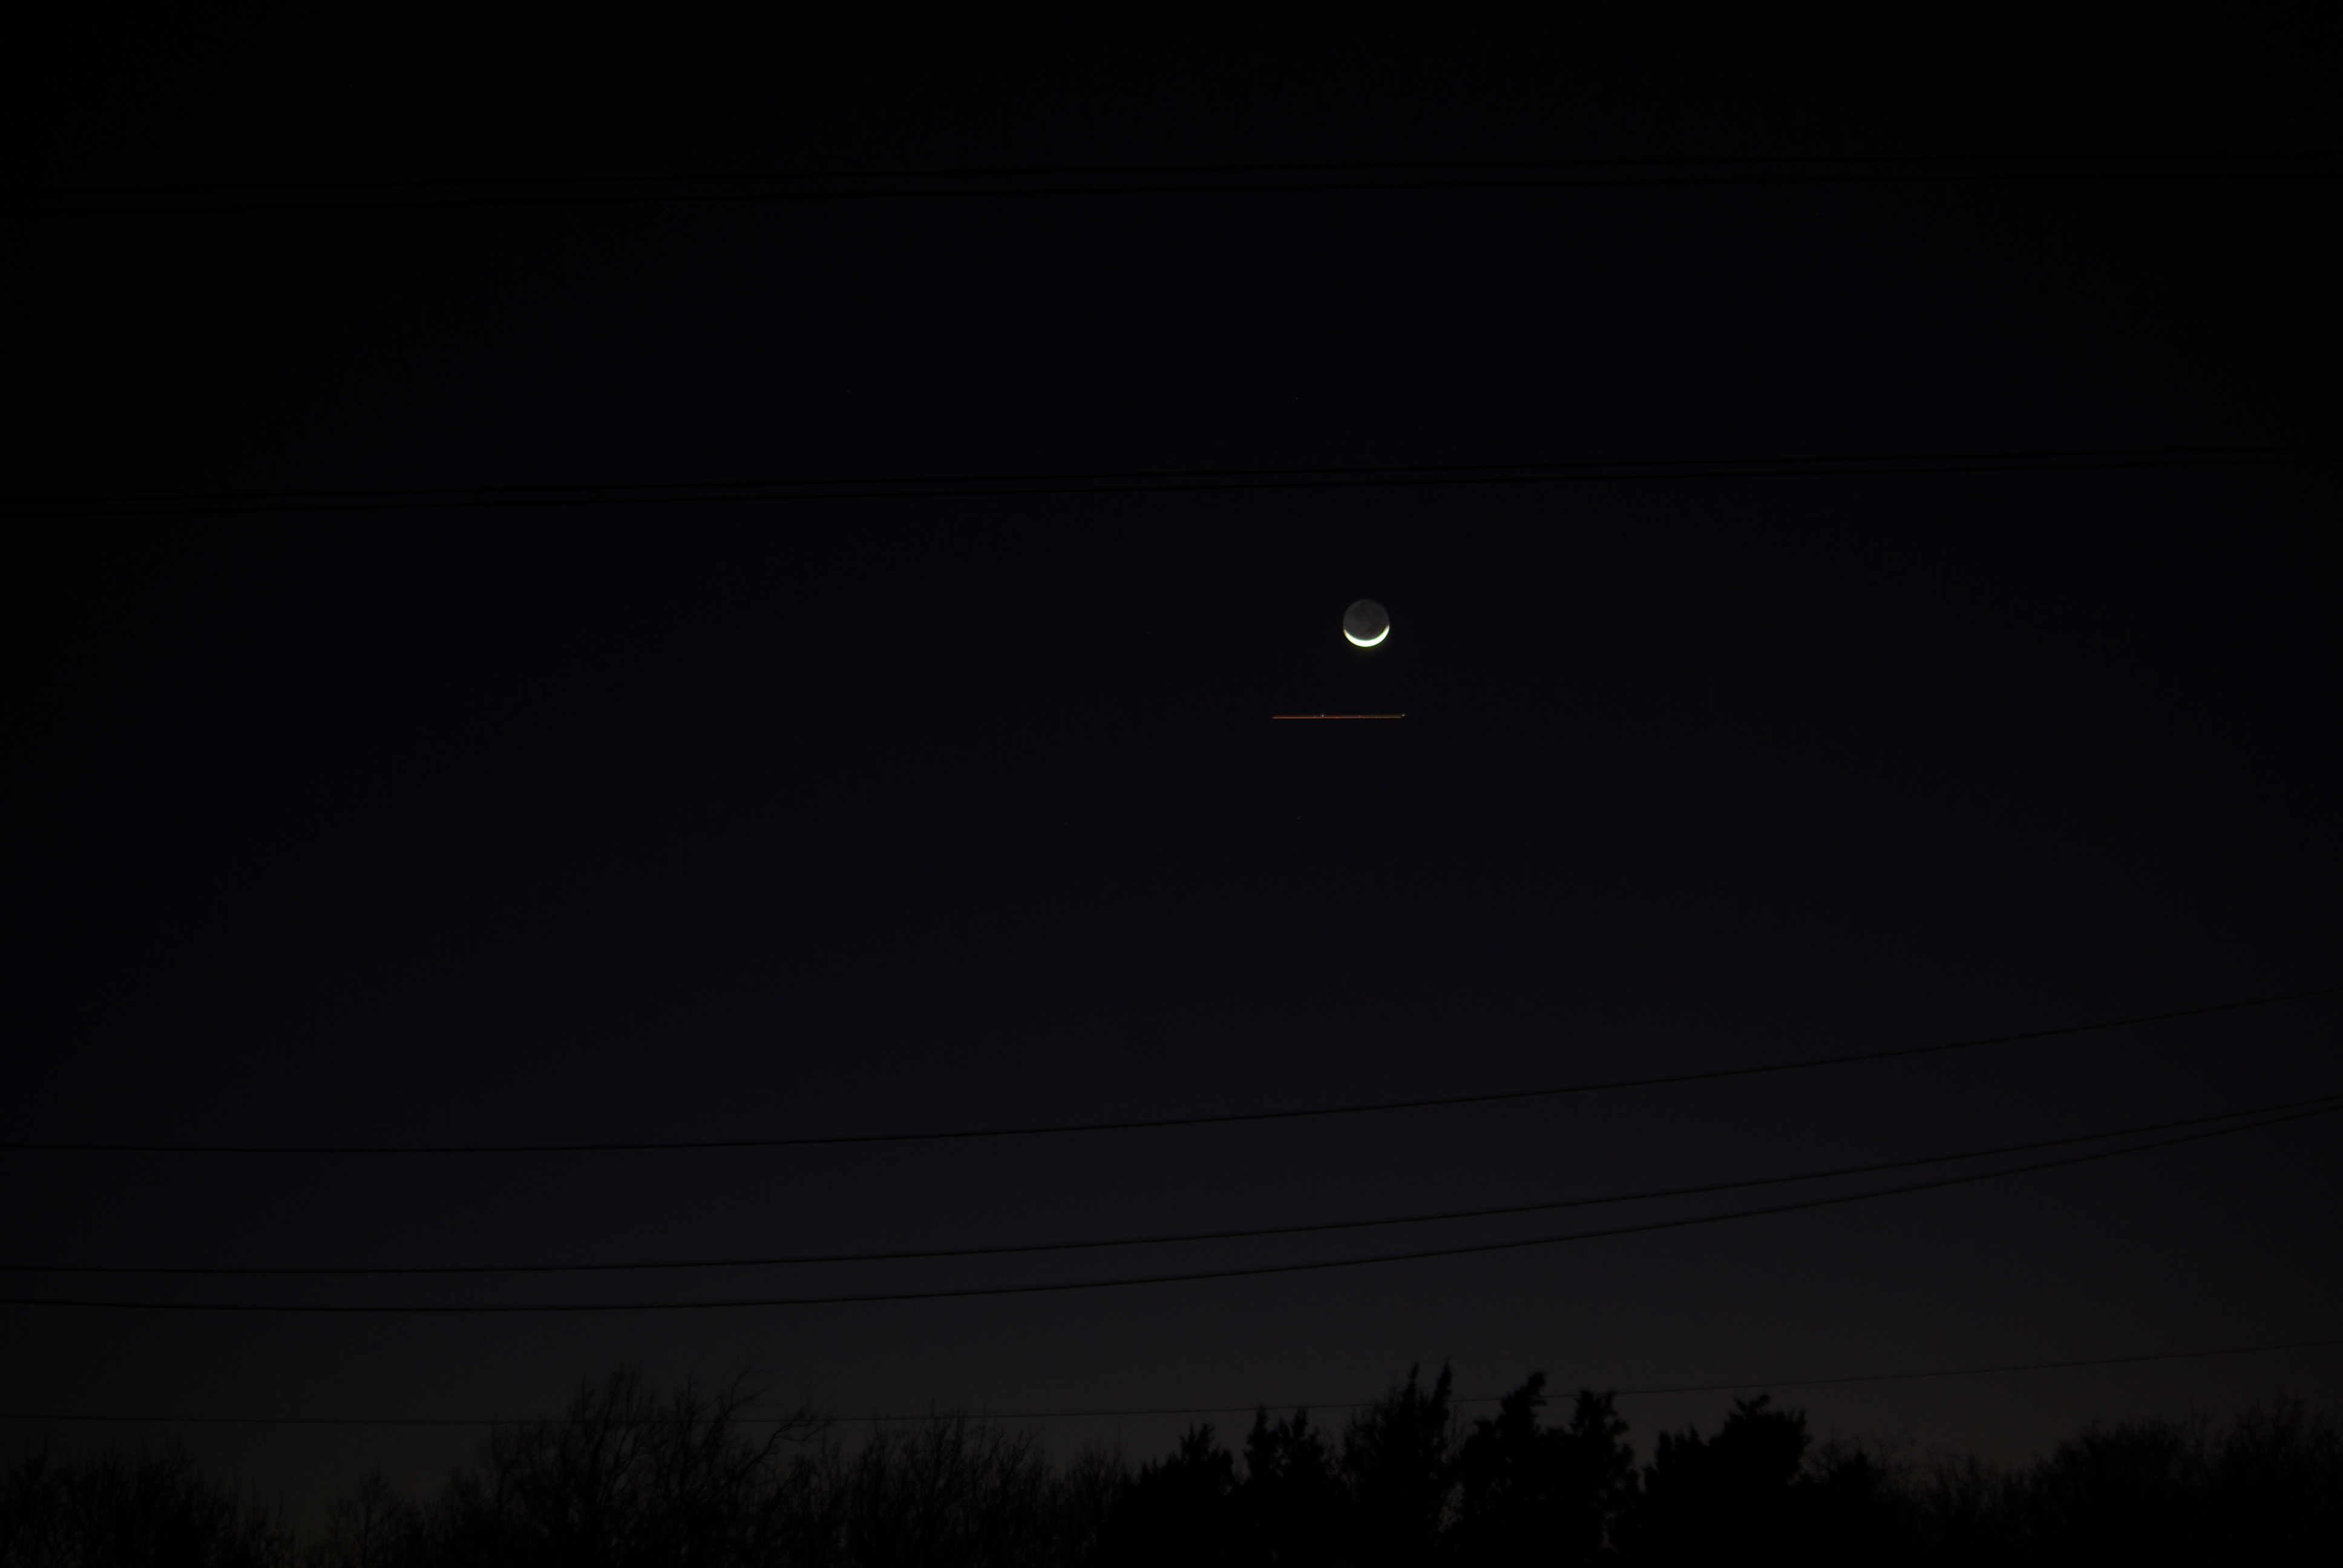
Here’s a photo of where it was supposed to be the evening of March 12. Nice sliver of a Moon.

A view to the west over south Grand Prairie, Texas, showing the sliver of the new Moon, but a no-show Comet Pan-STARRS, March 12, 2013. Photo by Ed, Kathryn and Peanut.
We watched for over an hour, from just after the Sun’s winking out in a blaze of orange (Texas dust and DFW smog). We were shooting without a tripod, and so it was difficult to capture just how thin was the line of the Moon for a long time. It was not a clear crescent, with mountains of the Moon providing jagged lines that glistened like a crystal glass necklace. Longer exposures revealed the comet to other observers in other places, but not to us. Perched as we were right on the edge of the Austin Chalk Escarpment, we were joined by a dozen or so others who hoped to see the comet, or who were just putting their BMX bikes away.
A more detailed, and grainy, shot of the Moon (with no comet):

Eventually the Moon stated its presence, but still no Comet Pan-STARRS, on March 12, 2013. Looking west over Grand Prairie, Texas. (Yeah, probably would have been a much better photo if not handheld.)
Here’s a photo of where it was supposed to be last night, the evening of March 13.
On March 13, Comet Pan -STARRS rode directly underneath the Moon; it’s invisible in this longer exposure, though you can see the streaking lights of a jetliner flying out of DFW International Airport under the Moon.
It’s like waiting for Godot. Waiting for Comet Godot.
Quoting from SamuellBeckett.net:
ESTRAGON: People are bloody ignorant apes. He rises painfully, goes limping to extreme left, halts, gazes into distance off with his hand screening his eyes, turns, goes to extreme right, gazes into distance. Vladimir watches him, then goes and picks up the boot, peers into it, drops it hastily.
VLADIMIR: Pah!He spits. Estragon moves to center, halts with his back to auditorium.
ESTRAGON: Charming spot. (He turns, advances to front, halts facing auditorium.)
Inspiring prospects. (He turns to Vladimir.)
Let’s go.
VLADIMIR: We can’t.
ESTRAGON: Why not?
VLADIMIR: We’re waiting for Godot.
ESTRAGON: (despairingly). Ah! (Pause.) You’re sure it was here?
VLADIMIR: What?
ESTRAGON: That we were to wait.
VLADIMIR: He said by the tree. (They look at the tree.) Do you see any others?
ESTRAGON: What is it?
VLADIMIR: I don’t know. A willow.
ESTRAGON: Where are the leaves?
VLADIMIR:
It must be dead.
More:

Other photographers found Comet Pan-STARRS. This photo comes via SpaceWeather.com. ” Brian Klimowski sends this picture from the countryside near Flagstaff, Arizona . . . ‘Beautiful show this evening!’ says Klimowski. ‘I took the photo from an altitude of about 9500 feet in the San Francisco Peaks near Flagstaff. A 1-second exposure with my Canon digital camera easily revealed the comet.'” Photo details: Canon 7D, 125 mm, 1s @ F/5.6. ISO 1250
Leave a Comment » | Astronomy, Nature, Outdoor Recreation, photography, Science | Tagged: Astronomy, Comet Pan-STARRS, NASA, Nature, Outdoor Recreation, photography, Science | Permalink
Posted by Ed Darrell

From NASA: Of the 10 million square miles (26 million square kilometers) of northern vegetated lands, 34 to 41 percent showed increases in plant growth (green and blue), 3 to 5 percent showed decreases in plant growth (orange and red), and 51 to 62 percent showed no changes (yellow) over the past 30 years. Satellite data in this visualization are from the AVHRR and MODIS instruments, which contribute to a vegetation index that allows researchers to track changes in plant growth over large areas. Credit: NASA’s Goddard Space Flight Center Scientific Visualization Studio; click image for original view; click here for greater detail
Press release from NASA, March 10, 2013 (links in text added here):
Amplified Greenhouse Effect Shifts North’s Growing Seasons
WASHINGTON — Vegetation growth at Earth’s northern latitudes increasingly resembles lusher latitudes to the south, according to a NASA-funded study based on a 30-year record of land surface and newly improved satellite data sets.
An international team of university and NASA scientists examined the relationship between changes in surface temperature and vegetation growth from 45 degrees north latitude to the Arctic Ocean. Results show temperature and vegetation growth at northern latitudes now resemble those found 4 degrees to 6 degrees of latitude farther south as recently as 1982.
“Higher northern latitudes are getting warmer, Arctic sea ice and the duration of snow cover are diminishing, the growing season is getting longer and plants are growing more,” said Ranga Myneni of Boston University’s Department of Earth and Environment. “In the north’s Arctic and boreal areas, the characteristics of the seasons are changing, leading to great disruptions for plants and related ecosystems.”
The study was published Sunday in the journal Nature Climate Change.
Myneni and colleagues used satellite data to quantify vegetation changes at different latitudes from 1982 to 2011. Data used in this study came from NOAA’s Advanced Very High Resolution Radiometers (AVHRR) onboard a series of polar-orbiting satellites and NASA’s Moderate Resolution Imaging Spectroradiometer (MODIS) instruments on the Terra and Aqua satellites.
As a result of enhanced warming and a longer growing season, large patches of vigorously productive vegetation now span a third of the northern landscape, or more than 3.5 million square miles (9 million square kilometers). That is an area about equal to the contiguous United States. This landscape resembles what was found 250 to 430 miles (400 to 700 kilometers) to the south in 1982.
“It’s like Winnipeg, Manitoba, moving to Minneapolis-Saint Paul in only 30 years,” said co-author Compton Tucker of NASA’s Goddard Space Flight Center in Greenbelt, Md.
The Arctic’s greenness is visible on the ground as an increasing abundance of tall shrubs and trees in locations all over the circumpolar Arctic. Greening in the adjacent boreal areas is more pronounced in Eurasia than in North America.
An amplified greenhouse effect is driving the changes, according to Myneni. Increased concentrations of heat-trapping gasses, such as water vapor, carbon dioxide and methane, cause Earth’s surface, ocean and lower atmosphere to warm. Warming reduces the extent of polar sea ice and snow cover, and, in turn, the darker ocean and land surfaces absorb more solar energy, thus further heating the air above them.
“This sets in motion a cycle of positive reinforcement between warming and loss of sea ice and snow cover, which we call the amplified greenhouse effect,” Myneni said. “The greenhouse effect could be further amplified in the future as soils in the north thaw, releasing potentially significant amounts of carbon dioxide and methane.”
To find out what is in store for future decades, the team analyzed 17 climate models. These models show that increased temperatures in Arctic and boreal regions would be the equivalent of a 20-degree latitude shift by the end of this century relative to a period of comparison from 1951-1980.
However, researchers say plant growth in the north may not continue on its current trajectory. The ramifications of an amplified greenhouse effect, such as frequent forest fires, outbreak of pest infestations and summertime droughts, may slow plant growth.
Also, warmer temperatures alone in the boreal zone do not guarantee more plant growth, which also depends on the availability of water and sunlight.
“Satellite data identify areas in the boreal zone that are warmer and dryer and ¬¬other areas that are warmer and wetter,” said co-author Ramakrishna Nemani of NASA’s Ames Research Center in Moffett Field, Calif. “Only the warmer and wetter areas support more growth.”
Researchers did find found more plant growth in the boreal zone from 1982 to 1992 than from 1992 to 2011, because water limitations were encountered in the latter two decades.
Data, results and computer codes from this study will be made available on NASA Earth Exchange (NEX), a collaborative supercomputing facility at Ames. NEX is designed to bring scientists together with data, models and computing resources to accelerate research and innovation and provide transparency.
For more information and images associated with this release, visit:
– end –
More:
2 Comments | Botany, Climate change, climate_change, CO2, Global warming, Greenhouse Gases, History, NASA, Science | Tagged: Botany, Climate change, Global warming, Goddard Space Flight Center, Greenhouse Effect, History, NASA, Science | Permalink
Posted by Ed Darrell
Here’s a guy who Paul Ryan, Eric Cantor and other “deficit hawks” refuse to debate. Grover Norquist blanches when you mention his name, and hopes and prays you won’t listen to him: Neil de Grasse Tyson.
The film was put together from several statements by Tyson, by Evan Schurr.
WRITE TO CONGRESS:
http://www.penny4nasa.org/take-action/The intention of this project is to stress the importance of advancing the space frontier and is focused on igniting scientific curiosity in the general public.
Facebook cover: (not sure who made this but thank you!)
http://i.imgur.com/yqAGm.png*FOR THOSE SAYING THE MUSIC IS TOO LOUD* This is the adjusted one http://youtu.be/Fl07UfRkPas
I give immense credit to The Sagan Series for providing the inspiration for this video.
http://www.youtube.com/user/damewse?f…Copyright Disclaimer Under Section 107 of the Copyright Act 1976, allowance is made for “fair use” for purposes such as criticism, comment, news reporting, teaching, scholarship, and research. Fair use is a use permitted by copyright statute that might otherwise be infringing. Non-profit, educational or personal use tips the balance in favor of fair use. All copyrighted materials contained herein belong to their respective copyright holders, I do not claim ownership over any of these materials. In no way do I benefit either financially or otherwise from this video.
MUSIC:
Arrival of the Birds and Transformation by The Cinematic Orchestra http://www.amazon.com/The-Crimson-Win……Credits
When We Left Earth http://dsc.discovery.com/tv/nasa/nasa…
The Daily Show with Jon Stewart http://www.thedailyshow.com/
HUBBLE 3D http://www.imax.com/hubble/
NASA TV http://www.nasa.gov/multimedia/nasatv…
The Amazing Meeting http://www.amazingmeeting.com/TAM2011/
“US Mint” http://www.youtube.com/watch?v=-ZzKDL…
“New $100 Note” http://www.youtube.com/watch?v=zgaytK…
Real Time with Bill Maher http://www.hbo.com/real-time-with-bil…
Pale Blue Dot – http://en.wikipedia.org/wiki/Pale_Blu…
STS-135 Ascent Imagery Highlights http://www.youtube.com/watch?v=ikzxtw…
CSPAN State of the Union Address http://www.c-span.org/
The Sagan Series http://www.facebook.com/thesaganseries
The Asteroid that Flattened Mars http://www.youtube.com/watch?v=JgMXPX…
University of Buffalo Communications http://www.communication.buffalo.edu/
Mars Curiosity Rover http://www.youtube.com/watch?v=hnlvvu…
Red Aurora Australis http://www.youtube.com/watch?v=hC7Qro…Thank you to user florentgermain for the French subtitles
Hey, this is a year old. Why are you sitting on your hands? Our future, our children’s future, our great-great-grandchildren’s futures, are on the line.
Tip of the old scrub brush to Robert Krulwich at NPR, who pulled this out and started discussing it again.
More:
1 Comment | Economics, History, NASA, Politics, Science, Space exploration, Space Race | Tagged: Economics, Educaiton, Government, History, NASA, Neil deGrasse Tyson, Politics, Science, Space exploration, The Future | Permalink
Posted by Ed Darrell
What’s it like to be an astronaut?
You gotta learn how to cook and eat snake.
A discovery engine for meaningful knowledge, fueled by cross-disciplinary curiosity.
Edited by Maria Popova for Lore.
Twitter: @explorerArt & Design Science & Technology Culture & Society History & Literature Creativity & Innovation Media & Communication Thought & Opinion About
Science & TechnologyHistory & Literature
What’s it like to be an astronaut? An animated first-hand account by NASA’s Jerry Carr, who tells his fascinating life story.Complement with Sally Ride’s first-hand account of what it’s like to take off on a Space Shuttle, and this illustrated chronology of the Space Age.
Do kids dream of being an astronaut any more? It’s a great, character-building dream.
Tip of the old scrub brush to BrainPicker, at Explore.
More:
Leave a Comment » | NASA, Science, Space exploration | Tagged: Astronaut, Brainpicker, Exploration, Jerry Carr, NASA, Science, Space Age, Space exploration | Permalink
Posted by Ed Darrell
This is a press release from NASA, presented here for the record, text unedited except for formatting where necessary, and the deletion of the press office phone numbers (I hope that’s not necessary, but earnest information seekers have links to get the information they seek). Images are inserted from other, related NASA sites.
Steve Cole
Headquarters, Washington
stephen.e.cole@nasa.govLeslie McCarthy
Goddard Institute for Space Studies, New York
leslie.m.mccarthy@nasa.govJan. 15, 2013
RELEASE : 13-021
NASA Finds 2012 Sustained Long-Term Climate Warming Trend
WASHINGTON — NASA scientists say 2012 was the ninth warmest of any year since 1880, continuing a long-term trend of rising global temperatures. With the exception of 1998, the nine warmest years in the 132-year record all have occurred since 2000, with 2010 and 2005 ranking as the hottest years on record.
NASA’s Goddard Institute for Space Studies (GISS) in New York, which monitors global surface temperatures on an ongoing basis, released an updated analysis Tuesday that compares temperatures around the globe in 2012 to the average global temperature from the mid-20th century. The comparison shows how Earth continues to experience warmer temperatures than several decades ago.
[Caption to video] NASA’s analysis of Earth’s surface temperature found that 2012 ranked as the ninth-warmest year since 1880. NASA scientists at the Goddard Institute for Space Studies (GISS) compare the average global temperature each year to the average from 1951 to 1980. This 30-year period provides a baseline from which to measure the warming Earth has experienced due to increasing atmospheric levels of heat-trapping greenhouse gases. While 2012 was the ninth-warmest year on record, all 10 of the warmest years in the GISS analysis have occurred since 1998, continuing a trend of temperatures well above the mid-20th century average. The record dates back to 1880 because that is when there were enough meteorological stations around the world to provide global temperature data.
Data source: NASA Goddard Institute for Space Studies
Visualization credit: NASA Goddard’s Scientific Visualization Studio› Download this video and related materials in HD formats
The average temperature in 2012 was about 58.3 degrees Fahrenheit (14.6 Celsius), which is 1.0 F (0.6 C) warmer than the mid-20th century baseline. The average global temperature has risen about 1.4 degrees F (0.8 C) since 1880, according to the new analysis.
Scientists emphasize that weather patterns always will cause fluctuations in average temperature from year to year, but the continued increase in greenhouse gas levels in Earth’s atmosphere assures a long-term rise in global temperatures. Each successive year will not necessarily be warmer than the year before, but on the current course of greenhouse gas increases, scientists expect each successive decade to be warmer than the previous decade.
“One more year of numbers isn’t in itself significant,” GISS climatologist Gavin Schmidt said. “What matters is this decade is warmer than the last decade, and that decade was warmer than the decade before. The planet is warming. The reason it’s warming is because we are pumping increasing amounts of carbon dioxide into the atmosphere.”
Carbon dioxide is a greenhouse gas that traps heat and largely controls Earth’s climate. It occurs naturally and also is emitted by the burning of fossil fuels for energy. Driven by increasing man-made emissions, the level of carbon dioxide in Earth’s atmosphere has been rising consistently for decades.
The carbon dioxide level in the atmosphere was about 285 parts per million in 1880, the first year in the GISS temperature record. By 1960, the atmospheric carbon dioxide concentration, measured at NOAA’s Mauna Loa Observatory, was about 315 parts per million. Today, that measurement exceeds 390 parts per million.

This map represents global temperature anomalies averaged from 2008 through 2012. Data source: NASA Goddard Institute for Space Studies Visualization credit: NASA Goddard’s Scientific Visualization Studio
› Larger image
› Larger image (tif)
› Color bar scale (png)While the globe experienced relatively warm temperatures in 2012, the continental U.S. endured its warmest year on record by far, according to NOAA, the official keeper of U.S. weather records.
“The U.S. temperatures in the summer of 2012 are an example of a new trend of outlying seasonal extremes that are warmer than the hottest seasonal temperatures of the mid-20th century,” GISS director James E. Hansen said. “The climate dice are now loaded. Some seasons still will be cooler than the long-term average, but the perceptive person should notice that the frequency of unusually warm extremes is increasing. It is the extremes that have the most impact on people and other life on the planet.”
The temperature analysis produced at GISS is compiled from weather data from more than 1,000 meteorological stations around the world, satellite observations of sea-surface temperature, and Antarctic research station measurements. A publicly available computer program is used to calculate the difference between surface temperature in a given month and the average temperature for the same place during 1951 to 1980. This three-decade period functions as a baseline for the analysis. The last year that experienced cooler temperatures than the 1951 to 1980 average was 1976.
The GISS temperature record is one of several global temperature analyses, along with those produced by the Met Office Hadley Centre in the United Kingdom and the National Oceanic and Atmospheric Administration’s National Climatic Data Center in Asheville, N.C. These three primary records use slightly different methods, but overall, their trends show close agreement.
For images related to the data, visit:
– end –
Related Links [from NASA]
› Goddard Institute for Space Studies GISTEMP Analysis
› Science Summary of NASA’s 2012 Temperature Analysis (pdf)
› NOAA State of the Climate Global Analysis: 2012
› Slides for Jan. 15 media teleconference (pdf)
› Download related multimedia in broadcast-suitable HD formats
More, and resources:
1 Comment | Carbon Dioxide, Climate change, climate_change, CO2, Global warming, History, NASA, NOAA, Science | Tagged: Carbon Dioxide, Climate change, CO2, Global warming, Goddard Institute for Space Studies, Hadley Centre for Climate Prediction and Research, History, NASA, National Climatic Data Center, Science | Permalink
Posted by Ed Darrell
December 27 is one of those days — many of us are off work, but it’s after Boxing Day, and it’s not yet on to New Year’s Eve or Day. We should have celebrated, maybe.
We should celebrate December 27 as a day of portent: A good embarkation, and a good, safe end to a nation-encouraging trip to almost touch the Moon.

HMS Beagle, on a voyage of discovery
On December 27, 1831, Charles Darwin and H.M.S. Beagle set sail on an around-the-world voyage of discovery that would change all of science, and especially biology, forever.
December 27 1831
After a few delays, H.M.S. Beagle headed out from Plymouth with a crew of 73 under clear skies and a good wind. Darwin became sea-sick almost immediately.
Darwin never fully overcame his seasickness, but he fought it well enough to become the single greatest collector of specimens in history for the British Museum and British science, a distinction that won him election to science societies even before his return from the trip — and cemented his life in science, instead of in the church. Darwin’s discoveries would have revolutionized biology in any case. In analyzing what he had found, a few years later and with the aid of experts at the British Museum, Darwin realized he had disproved much of William Paley’s hypotheses about life and its diversity, and that another, more basic explanation was possible. This led to his discovery of evolution by natural and sexual selection.

Mini-sheet from the Royal Mail in 2009 honoring Darwin’s discoveries in the Galapagos Islands
On December 27, 1968, Apollo 8 splashed down after a successful and heartening trip to orbit the Moon. The three crewmen, Commander Frank Borman, James A. Lovell, Jr., and William A. Anders, had orbited the Moon, a very important milestone in the methodological race to put humans on the Moon (which would be accomplished seven months later). 1968 was a terrible year for the U.S., with the North Korean capture of the U.S.S. Pueblo, assassinations of Rev. Martin Luther King, Jr., and Sen. Robert F. Kennedy during the presidential campaign, riots in dozens of American cities, nasty political conventions with riots at the Democratic Convention in Chicago, a contentious and bitter election making sore the nation’s divide over Vietnam policy, and other problems. On Christmas Eve, Borman, Lovell and Anders broadcast from orbit around the Moon, a triumphant and touching moment for the Apollo Program and Americans around the world. Their safe return on December 27 raised hopes for a better year in 1969.
Motherboard.tv has a great write up from Alex Pasternack:
In 1968, NASA engineers were scrambling to meet President Kennedy’s challenge to land a man on the moon by decade’s end. Because delays with the lunar module were threatening to slow the Apollo program, NASA chose to change mission plans and send the crew of Apollo 8 all the way to the moon without a lunar module.
Exactly 43 years ago, the three astronauts of Apollo 8 became the first humans to orbit another celestial object. As they came around the dark side of the Moon for the third time, Frank Borman, the commander, finally turned their capsule around. And then they saw the Earth.
Borman: Oh my God! Look at that picture over there! Here’s the Earth coming up. Wow, is that pretty.
Anders: Hey, don’t take that, it’s not scheduled.
Borman: (laughing) You got a color film, Jim?
Anders: Hand me that roll of color quick, will you…One of the resulting photos taken by Anders on a Hasselblad camera became one of the world’s most iconic images.
As Bill Anders recalls it:
I just happened to have one with color film in it and a long lens. All I did was to keep snapping… It’s not a very good photo as photos go, but it’s a special one. It was the first statement of our planet Earth and it was particularly impressive because it’s contrasted against this startling horizon… After all the training and studying we’d done as pilots and engineers to get to the moon safely and get back, [and] as human beings to explore moon orbit, what we really discovered was the planet Earth.
Plan to raise a glass today, December 27, 2012, to Great Beginnings Day for the human race. December 27 is a day we should remember, for these achievements.
Also on December 27:
Adapted from a post from 2010.
More:
5 Comments | Apollo Project, Charles Darwin, Darwin, Evolution, History, NASA, Science, Space exploration, Space Race | Tagged: Apollo 8, Charles Darwin, December 27, Evolution, History, NASA, Space Exploration Science, The Beagle | Permalink
Posted by Ed Darrell
No! Someone whose comments don’t show up at Steve Goddard’s blog? Must be some massive disruption in the force of the Tubes of the Interweb thingy.
What is this guy Tony on about?
At Steve Goddard’s blog — this is the same guy who said the western drought was over because Lake Powell rose a few feet, though the drought raged on everywhere else — Goddard and his flying and limping monkeys have been poking fun at something James Hansen is alleged to have said:
According to NASA’s top scientist, Manhattan has been underwater for the past four years, and is experiencing a horrific drought.
While doing research 12 or 13 years ago, I met Jim Hansen, the scientist who in 1988 predicted the greenhouse effect before Congress. I went over to the window with him and looked out on Broadway in New York City and said, “If what you’re saying about the greenhouse effect is true, is anything going to look different down there in 20 years?” He looked for a while and was quiet and didn’t say anything for a couple seconds. Then he said, “Well, there will be more traffic.” I, of course, didn’t think he heard the question right. Then he explained, “The West Side Highway [which runs along the Hudson River] will be under water. And there will be tape across the windows across the street because of high winds. And the same birds won’t be there. The trees in the median strip will change.” Then he said, “There will be more police cars.” Why? “Well, you know what happens to crime when the heat goes up.”
And so far, over the last 10 years, we’ve had 10 of the hottest years on record. [Quoting an article at Salon]
The West Side Highway under water? Ha.
Goddard’s blog has used Hansen’s quote as a regular punchline, not noticing that Hansen said “in 20 to 30 years,” and assuming he was just awfully, comically wrong. 30 years from 1988 will be 2018. This year is 2012, six years to go. Goddard tried to ridicule Hansen a few times over the past couple of years, for example:
AP may complain about this use, but this is an academic, learning exercise:
Caption from Yahoo! News: This photo provided by Dylan Patrick shows flooding along the Westside Highway near the USS Intrepid as Sandy moves through the area Monday, Oct. 29, 2012 in New York. Much of New York was plunged into darkness Monday by a superstorm that overflowed the city’s historic waterfront, flooded the financial district and subway tunnels and cut power to nearly a million people. (AP Photo/Dylan Patrick) MANDATORY CREDIT: DYLAN PATRICK
Dylan Patrick got the photographic evidence that shows, once again, warming denialists really are a classless, fact-lacking bunch. CNN has photos from Dylanphoto1 (the same guy, almost certainly), in a slide show, noting, “Most of the Westside Highway south of 49th street is flooded all the way down, and in front of the USS Intrepid.” Across from Pier 88 and the USS Intrepid, the street is indeed underwater.
So we learn that, as a comedian, Steve Goddard has an extremely limited range and depends on a sympathetic room to get laughs; and as a climate scientist, he is even more limited, and wrong, with 6 years to go in the 20 to 30 year range James Hansen offered. And we learn once again, sadly, that James Hansen was right back in 1988 when he hit the claxons to warn us of global warming.
23 times Goddard repeated the charge? Do you get the idea that “climate skeptics” ran out of material years ago, and have been dancing a cover-up for a very, very long time? Hurricane Sandy blew and floated his claim away.
More:
Even more, a bit later:
41 Comments | History, Science | Tagged: Climate change, denialism, Global warming, History, Hurrican Sandy, James Hansen, NASA, Science, West Side Highway | Permalink
Posted by Ed Darrell
Real science often is more fantastic that the stuff people make up. Haldane was right.

Not the Sun you’re used to seeing.
In a century our studies of the Sun progressed from the deep calculations based on erroneous assumptions of what our star is make of (Lord Kelvin‘s calculations on how long the iron in the Sun would take to cool to its present color), to today’s solar studies, in which nearly every moment of the Sun’s life is recorded through a half dozen different sensors, by satellites and telescopes and whatever other means we have to capture data from the Sun’s burning.
It’s hard science — but it borders on art, too, doesn’t it? Watch this:
Gradient Sun [HD Video], originally uploaded by NASA Goddard Photo and Video.
What’s going on here?
Via Flickr:
Watching a particularly beautiful movie of the sun helps show how the lines between science and art can sometimes blur. But there is more to the connection between the two disciplines: science and art techniques are often quite similar, indeed one may inform the other or be improved based on lessons from the other arena. One such case is a technique known as a “gradient filter” – recognizable to many people as an option available on a photo-editing program. Gradients are, in fact, a mathematical description that highlights the places of greatest physical change in space. A gradient filter, in turn, enhances places of contrast, making them all the more obviously different, a useful tool when adjusting photos. Scientists, too, use gradient filters to enhance contrast, using them to accentuate fine structures that might otherwise be lost in the background noise. On the sun, for example, scientists wish to study a phenomenon known as coronal loops, which are giant arcs of solar material constrained to travel along that particular path by the magnetic fields in the sun’s atmosphere. Observations of the loops, which can be more or less tangled and complex during different phases of the sun’s 11-year activity cycle, can help researchers understand what’s happening with the sun’s complex magnetic fields, fields that can also power great eruptions on the sun such as solar flares or coronal mass ejections.
The images here show an unfiltered image from the sun next to one that has been processed using a gradient filter. Note how the coronal loops are sharp and defined, making them all the more easy to study. On the other hand, gradients also make great art. Watch the movie to see how the sharp loops on the sun next to the more fuzzy areas in the lower solar atmosphere provide a dazzling show.
NASA/Goddard Space Flight Center
NASA/Goddard Space Flight Center
To download this video go to: svs.gsfc.nasa.gov/goto?11112
NASA Goddard Space Flight Center enables NASA’s mission through four scientific endeavors: Earth Science, Heliophysics, Solar System Exploration, and Astrophysics. Goddard plays a leading role in NASA’s accomplishments by contributing compelling scientific knowledge to advance the Agency’s mission.
Follow us on Twitter
Like us on Facebook
Find us on Instagram
Teachers ought to figure out how to use this in classrooms — and I don’t mean astronomy, physics and chemistry only. Can you find a use for this film in geography? History? English and literature?
Sometime shortly after World War II scientists captured film of a mass coronal ejection from the Sun. You probably can imagine the film I’m remembering. That snippet found its way into films students saw in science, geography, chemistry, biology (“this is our Sun, from which all living things get energy, through photosynthesis”), and probably a half dozen other subjects. It was spectacular, and it was just about all that was available for classroom use, then. Students now probably have never seen it. Worse, my experience is that students in high school generally have very little familiarity with the science projects carried out by agencies like NASA and the National Science Foundation, and they know very little about the Sun, or the Moon and other planets.
Teachers, the state isn’t going to help you put this into your classrooms. Can you figure out some way to get it in?
More:
Leave a Comment » | Astronomy, Education, History, NASA, Nature, Physics, Science | Tagged: classroom video, Coronal loop, Education, Goddard Space Flight Center, Heliophysics, History, NASA, Science, Sun | Permalink
Posted by Ed Darrell


Ed Darrell on Texas's Colorado River


Come on in, the water's fine. Come often: Cleanliness is next to godliness.


