May 13, 2014

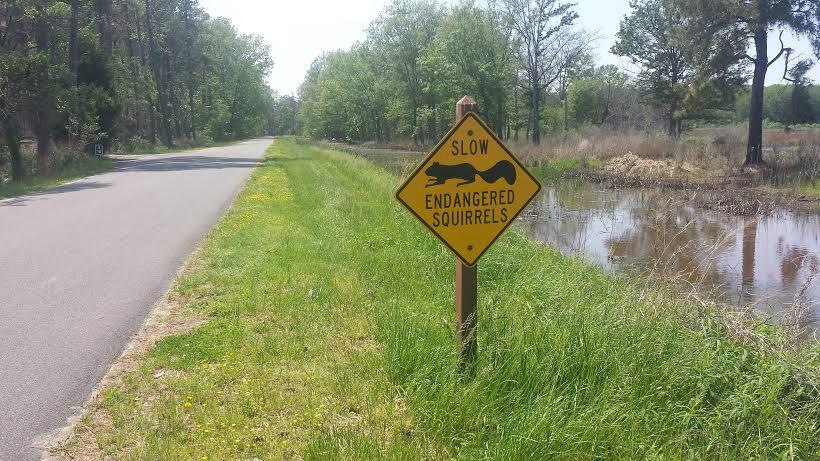
From jbendery (Jennifer Bendery) — I learned today that there are endangered squirrels, and apparently they have ginormous tails. (h/t @kate_sheppard) pic.twitter.com/Uu4QxiDa5M
A lot of punchlines possible, e.g., ‘if the squirrels weren’t slow, maybe they wouldn’t be endangered.’
Still a rather unique sign, no?
I wonder where it is? This sign marks habitat in the Blackwater National Wildlife Refuge in Maryland for the Delmarva fox squirrel.
Update: Well, maybe not wholly unique; World Wildlife Fund has this one — again, without a note about location.

© Michael Mallet
Spread the word; friends don't allow friends to repeat history.
 2 Comments |
  endangered species, Humor, Signs | Tagged: endangered species, Humor, Signs, Wildlife |
  Permalink
 Posted by Ed Darrell
May 13, 2014

National Overview – April 2014, from NOAA’s National Climatic Data Center
NOAA publishes these data monthly. We tend to ignore them, as background noise.
But click over to NOAA’s site, look at the charts and click to follow links. Ponder the story being told.
This is the snapshot for April 2014.
Major climate events NOAA is closely monitoring:
- Drought in the West, Central and Southern Plains, and Midwest. Long- and short-term dryness will increase wildfire risk and continue to have impacts on water resources and agriculture.
- El Niño development likely this summer or autumn. According to NOAA’s Climate Prediction Center, there is a greater than 65 percent chance of El Niño conditions developing later this year, which could have significant impacts on temperature and precipitation patterns across the U.S. More information is available from the Climate Prediction Center.
Supplemental April 2014 Information
- Climate Highlights — April
- The average temperature for the contiguous U.S. during April was 51.7°F, which was 0.7°F above the 20th century average. This was the 46th warmest April in the 120-year period of record.
- Much of the contiguous U.S. had April temperatures near the 20th century average. Above-average temperatures were scattered along the West Coast and in the Southwest, the Southern Plains, and across parts of the Ohio Valley and the Southeast. Below-average temperatures were observed across parts of the Upper Midwest and Northern Plains. No state had April temperatures among their 10 warmest or coolest.
- Alaska had the 12th warmest April of its 96-year period of record, with a temperature 3.8°F above the 1971-2000 average. This was the warmest April for Alaska since 2007. Much of the warmth was situated in western Alaska, where Nome had its fourth warmest April since local records began in 1907. The April precipitation total in Alaska was 23.3 percent below the 1971-2000 average, the 23rd driest April on record. Anchorage had its fifth driest April with only nine percent of normal monthly precipitation.
- The April contiguous U.S. precipitation total of 2.83 inches was 0.31 inch above the 20th century average and the 30th wettest April on record.
- Above-average precipitation in the Upper Midwest resulted in Wisconsin having its third wettest April and Minnesota its eighth wettest. Heavy precipitation across the Southeast, particularly near the end of the month, caused Alabama to have its fifth wettest April, Georgia its seventh wettest, and Florida its ninth wettest.
- On April 29th and 30th, torrential rain fell across the Southeast, Mid-Atlantic and Northeast causing significant flash flooding. The Gulf Coast of Alabama and the Florida panhandle bore the brunt of the heavy rains. At the Pensacola Regional Airport, in Florida, the two-day precipitation total was 20.47 inches, with 15.55 inches of the total falling on the 29th, breaking both one-day and two-day precipitation records; local records date back to 1879. On the 29th, Mobile, Alabama received 11.24 inches of rain, the third greatest calendar day rainfall total for the city since local records began in 1871. According to the 2014 National Climate Assessment released on May 6th, the amount of heavy precipitation falling in single events has increased by 27 percent across the Southeast since 1958. This event is consistent with projections of increases in the frequency and intensity of extreme precipitation events across the U.S. as the world warms.
- Below-average precipitation was observed across parts of the West, the central Rockies, and the Central and Southern Plains. Oklahoma had its 12th driest April on record, with 50 percent of average precipitation. Parts of Texas were also particularly dry, where San Angelo observed just 30 percent of normal monthly precipitation.
- According to the April 29thU.S. Drought Monitor report, 38.4 percent of the contiguous U.S. was in drought, nearly the same as the beginning of April, with both improvement and degradation of drought conditions on regional scales. Beneficial rain improved drought conditions across the Upper Midwest and Southeast during the month, while drought conditions worsened in parts of the West and across portions of the Central and Southern Plains.
- Drought conditions improved in Hawaii during April due in part to heavy rainfall at the end of March and the beginning of April. Only 0.7 percent of the state was experiencing drought conditions on April 29th, down from 14.4 percent at the beginning of the month. This was the smallest drought footprint for Hawaii since April 2008, and the first time since June 2008 that no part of the state was experiencing severe drought. Most of the drought improvement occurred across the Big Island, with central Molokai still experiencing moderate drought conditions.
- A severe weather outbreak on April 27-29 spawned at least 38 tornadoes from Nebraska to North Carolina, according to preliminary estimates from NOAA’s Storm Prediction Center. At least 32 fatalities were blamed on the tornadoes, with Arkansas and Mississippi being the hardest hit. An EF-4 tornado in Pulaski and White counties in Arkansas resulted in 15 fatalities, while an EF-4 in Winston County, Mississippi resulted in nine fatalities.
- Based on NOAA’s Residential Energy Demand Temperature Index (REDTI), the contiguous U.S. temperature-related energy demand during April was 28 percent below average and the 37th lowest in the 1895-2014 period of record.
- During April, there were about 75 percent more cold daily temperature records (1,419 cold maximum temperature records, 1,380 cold minimum temperature records; 2,799 total) than warm daily temperature records (544 warm maximum temperature records, 1,039 warm minimum temperature records; 1,583 total).
- Climate Highlights — year-to-date (January – April)
- For the first four months of 2014, the contiguous U.S. temperature was 38.7°F, 0.4°F below the 20th century average, and the 46th coldest January-April on record. This was the coldest four-month start to a year since 1993.
- Below-average temperatures were widespread across the eastern U.S. where 13 states had January-April temperatures among their 10 coldest on record. The coldest departures from average occurred across the Midwest. No state had its coldest January-April on record.
- Warm conditions were observed across a large portion of the West. Arizona and California were both record warm, with four-month temperatures 4.5°F and 5.2°F above their 20th century average, respectively. Nevada, Oregon and Utah each had one of their five warmest January-April periods on record.
- The year-to-date precipitation total for the contiguous U.S. was 8.79 inches, 0.68 inch above the 20th century average and the 33rd driest January-April on record.
- Below-average four-month precipitation totals were widespread across the Southwest and the Central and Southern Plains. Arizona, Kansas, New Mexico, Oklahoma, and Texas each had January-April precipitation totals that ranked among their 10 driest on record. Oklahoma had its second driest January-April on record, with less than half of average precipitation; 1936 was the driest. The dry conditions across Oklahoma decimated much of the winter wheat crop in the state, with estimates of the lowest harvested yield since 1957. In west Texas, precipitation deficits that date back to 2010 have been unprecedented in the observational record, with nearly every major reservoir in the region at less than 40 percent of capacity.
- The U.S. Climate Extremes Index (USCEI) for the year-to-date was the 14th highest on record for the period at 145 percent of average. Elements that contributed to the above-average USCEI included the spatial extent of cold maximum and minimum temperatures, warm maximum temperatures and the spatial extent of drought. The USCEI is an index that tracks extremes (falling in the upper or lower 10 percent of the record) in temperature, precipitation and drought across the contiguous U.S.
- Based on REDTI, the contiguous U.S. temperature-related energy demand during January-April was 27 percent above average and the 29th highest in the 1895-2014 period of record.
Galileo may have put it like this: Eppure, lei si scalda!
Spread the word; friends don't allow friends to repeat history.
 15 Comments |
  Climate change, climate_change, Global warming, NOAA, Science | Tagged: Climate change, Global warming, NOAA, Science |
  Permalink
 Posted by Ed Darrell
May 13, 2014

Milky Way over Monument Valley Navajo Tribal Park. Photo by Gavin Heffernan and Harun Mehmedinović, from the video (which also features Grand Canyon National Park)
Phil Plait’s column/blog at Slate, Bad Astronomy, put me on to this one. Wow.
You can see it at Vimeo, and read a lot more about the making of the film.
YIKÁÍSDÁHÁ (Navajo for Milky Way or “That Which Awaits the Dawn”)
Phil wrote:
And that they do. The Milky Way is the star of the show; the galactic bulge, disk, and dark fingers of vast dust lanes as clear as if this were taken from space. Well, sort of; I was impressed by the mix of clouds and sky, to be honest. The contrast was interesting, and it’s rather amazing the Milky Way could stand out so clearly above the cloud line.
One thing I want to point out specifically: At 2:10 in, a meteor flashes and leaves behind a curling wisp of what looks like smoke. This is called a persistent train, the vaporized remains of the meteoroid itself, and can glow for several minutes. The upper level winds from 60–100 km above Earth’s surface are what blow it into those curlicues.
More details, for more films from these guys:
Shot and Produced by: Gavin Heffernan and Harun Mehmedinović
Music: A Seated Night (Ambient) by Moby. Courtesy MobyGratis.com / Unknown Native Chant
Thanks: Northern Arizona University, Grand Canyon National Park, Monument Valley Tribal Park.
See other Sunchaser Timelapses on Vimeo here: vimeo.com/album/189653
LIKE Sunchaser Pictures on Facebook! facebook.com/SunchaserPicturesPage
LIKE Bloodhoney on Facebook! facebook.com/blood.honey.by.harun.mehmedinovic
For more from the artists:
BloodHoney.com
SunchaserPictures.com
Spread the word; friends don't allow friends to repeat history.
 Leave a Comment » |
  Astronomy, National Parks, Nature, Navajo, Outdoor Recreation, photography, Time-lapse photography, Travel | Tagged: Arizona, Astronomy, Bad Astronomy, Milky Way, Monument Valley Navajo Tribal Park, Nature, Outdoor Recreation, Phil Plait, photography, Timelapse, Travel |
  Permalink
 Posted by Ed Darrell


 Posted by Ed Darrell


